The email address in "Contact AK: Ads and more" above will vanish from November 2018.

PRIVACY POLICY

FAKE ASSI AK71 IN HWZ.

Featured blog.

1M50 CPF millionaire in 2021!

Ever since the CPFB introduced a colorful pie chart of our CPF savings a few years ago, I would look forward to mine every year like a teena...

Past blog posts now load week by week. The old style created a problem for some as the system would load 50 blog posts each time. Hope the new style is better. Search archives in box below.

Archives

"E-book" by AK

Second "e-book".

Another free "e-book".

4th free "e-book".

Pageviews since Dec'09

Financially free and Facebook free!

Recent Comments

ASSI's Guest bloggers

Charts in brief: 21 Jun 10.

Monday, June 21, 2010

Most counters in my watchlist are positive today as the STI gained to close just a whisker off 2,880. It would seem that the Chinese government has done the world a great favour by deciding to let the RMB strengthen. This is something I have believed should happen for some time. A stronger RMB would ameliorate the problem of inflation within China, raise the purchasing power of its people and improve standards of living. Increased domestic consumption would do a lot of good for China's own economy as well as the global economy. You might want to read what I wrote in an earlier post here.


AIMS AMP Capital Industrial REIT: Volume expanded today and all trades were done at only one price, 22c. MACD has turned up.  MACD histogram has a buy signal. MFI has turned up, forming a higher low. OBV has turned up, suggesting increased accumulation.


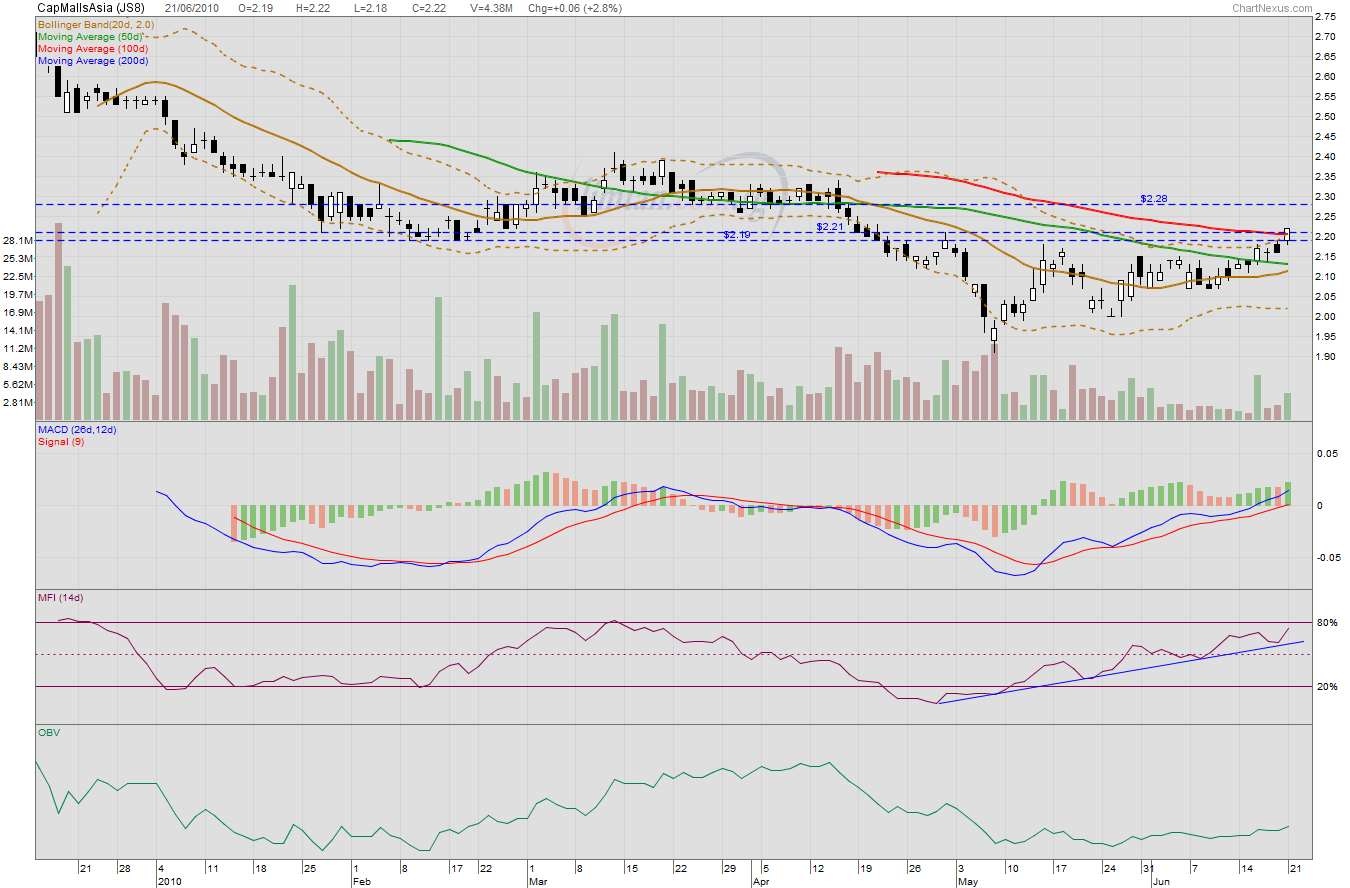
CapitaMalls Asia: Price broke the resistance band of $2.19 to $2.21 which I identified earlier. Closing at $2.22 seems bullish but volume suggests that this might not be durable. This counter is probably rising due to a lack of sellers rather than an abundance of buyers. Nonetheless, the momentum is still good as suggested by the MFI and price might be pushed higher.


Courage Marine: The picture is somewhat similar to CapitaMalls Asia.  A white candle day on improved volume but not impressively so which suggests a lack of sellers rather than an abundance of buyers. MFI shows improving momentum while the OBV has turned up slightly.  It remains to be seen if resistance at 20c could be taken out. A significant resistance after 20c is at 21c.


FSL Trust: MFI and OBV continue to rise. Could 40c be taken out this week? The next resistance level which is likely to be a strong one as suggested by candlesticks and a declining 20dMA is at 42c.


Golden Agriculture: Price continues to be resisted at 55c although it touched a high of 55.5c today. Momentum is still positive and MACD is about to cross into positive territory. Volume is, however, unimpressive which probably resulted in the failure to take out 55c and instead formed a white spinning top which is a possible reversal signal.  Support is at 51.5c in case of a trend reversal.


LMIR: It seems that the merged 100d and 200d MAs are too strong to be taken out today. Price closed at 47.5c which is where we find the 50dMA, forming an inverted cross in the process. The negative divergence between price and volume continues to suggest LMIR has been rising on weak technicals. If the 50dMA does not hold up as support, the next support is at 46c as provided by the 20dMA.


Related posts:
AIMS AMP Capital Industrial REIT: Big boys.
Courage Marine: Triple bottom?
Golden Agriculture: Resistance remains at 55c.
LMIR: Testing resistance.
FSL Trust: Verona I.

AIMS AMP Capital Industrial REIT: Big boys.

This REIT is generally thinly traded but on some days trading volume would spike.  In recent weeks, I have noticed quite a few single large volume buy ups.  These buy ups were usually to the tune of millions of units. This morning at 11.27AM, 2,825,000 units were bought up at 22c. Again, a single large volume buy up.

I went through the manager's annual report over the weekend and they have a very clear idea on the REIT's direction and what they will do in time. They want to offload their Japanese property and concentrate on Singapore.  They want to offload some underperforming properties in Singapore too.  If they manage to divest these properties, they might pay down the REIT's loans or look for better prospects within the industrial real estate sector in Singapore.  In time, they want to venture into high growth China.

Looking at the OBV, it is obvious that there has been steady accumulation in recent times although the momentum has not always been positive. Has this REIT, with its relatively high yield, low gearing and big discount to NAV, heightened the interest of big boys?

A quick check on SGX's website reveals the following:
3 June 10 - APG ALGEMENE PENSIOEN GROEP N.V.  increased its stake from 8.935% to 9.307%. That was their second major purchase within a short time.  An earlier major purchase happened end of May which bumped up their stake from 7.862% . They currently own about 136,501 lots.

Given such a consideration, for anyone who is thinking of buying into this REIT, hedging with a position initially at or close to 21.5c resistance turned support might be a good idea.  It would be sweet to buy closer to the support of the trading range which remains at 20c. However, it might or might not happen.  Hedging is probably again the way to go.

Hedging and precious metals.

Sunday, June 20, 2010

I have always liked hedging. Why? Because there are very few absolutes in this world. Anything is possible and we can only work on probabilities.  So, plans which do not take into consideration how things might go awry are not sound ones. Even with hedging and contingency plans in place, we might still end up with the shorter end of the stick sometimes. Well, the Chinese has a saying: "Humans plan but the Heavens fulfill."  Sometimes, things do go wrong.  Do what we can to reduce risks but we cannot eliminate risks.

My greatest losses in investments usually resulted from not taking enough precautionary measures to reduce risks. Sometimes, I just threw caution to the wind and went with my heart and, in most such instances, ended up with a broken heart and a thinner wallet. Actually, the pain from such experiences is good in a perverse way because I would then go back to basics and become very cautious again. This is what being human is about, perhaps.

Gold has hit a new record high of US$ 1,258 an ounce.  I have talked about buying physical gold as a hedge against all other forms of investments and against fiat currencies for some time now.  However, with gold's price rising higher and higher, silver is looking more and more attractive.


On 7 February, I blogged about how silver offered more value than gold. I said "Silver is currently trading at the higher end of the Gold:Silver ratio since 1980. Silver is now US$15.15/oz while gold is US$ 1,052.20/oz. This gives us a ratio of 69.45 to 1. This is closer to the historical high of 99.8 to 1. So, there seems to be some truth in the claim that silver is undervalued now and that it is a laggard in the realm of precious metals or it could also mean that gold is simply too expensive. Some hedging might not be a bad idea."

At that time, a reader mentioned that it might be better to wait for US$12 to US$13 an ounce before accumulating silver and my reply was "Yes, I saw the head and shoulders pattern and the neckline broken. There is support at US$15. This, however, was violated recently as price dipped below US$15 for a while but recovered. I see support at US$14 as well. US$12-13? Possible, of course.

 
"But with limited downside compared to the potential upside, I prefer to average in slowly. After all, TA shows where the supports are but it does not mean that the supports will be hit. I will buy some at current price level and if it weakens, I will accumulate. I believe in hedging."
 
Anyone who went ahead and started a Silver Savings Account with UOB back in February then would be in the money today. 

Now, with gold at US$ 1,258 an ounce and silver at US$ 19.17 an ounce, one ounce of gold would buy you 65.62 ounces of silver.  Compared to 7 February when one ounce of gold could have bought you 69.45 ounces of silver, the rate at which the price of silver is rising since then is faster than gold's.  If we believe in charting, silver's longer term trend is still up and I would buy more on weakness.

Related post:
Gold at US$1,210 an ounce.

Golden Agriculture: Resistance remains at 55c.

Friday, June 18, 2010

55c is still the resistance to watch.  Volume is drying up as price might have peaked for now. We see a negative divergence between price and volume. Immediate support is at 51.5c, as provided by the gently rising 200dMA. 


The declining 50dMA seems set to form a dead cross with the flat 100dMA in the next session. This might exert some bearish pressure on the share price. The MACD is rising but is still in negative territory and the recent recovery in price might turn out to be just a rebound. 

The MFI has declined but it remains to be seen if it could bounce off its own uptrend support.  If it could, it would suggest that positive buying momentum is still alive which provides hope for bulls here.

Personally, I would wait for a test of support at 51.5c if I really want to have a long position in this counter as its technicals are not particularly strong at the moment. With CPO price firmly in a downtrend, neither are its fundamentals.

Asian plantation stocks, including those in Singapore, lack catalysts to head higher over next 12 months as industry fundamentals not supportive, says Macquarie, according to Dow Jones.

 
Macquarie says CPO prices may face pressure given record soybean inventories (palm oil is substitute for soybean oil), narrow price discount between CPO and soy oil, increased CPO inventories due to seasonal recovery in production.


SPH: Another pleasant surprise.

SPH has delivered another pleasant surprise today. Volume expanded and its share price closed at $3.88.  My overnight sell queues at $3.82 and $3.88 were both done today and made me some pocket money.

617 lots were bought up at $3.88 at 5.05pm, up 4c from $3.84 when the market closed at 5pm.  Some people were really keen to lay their hands on some SPH shares today.


We have two white candles in a row and they are without any top wicks.  Bullish.  Volume, however, is not too impressive. MFI rose and has peeked above 50%.  OBV is rising gently.  The MACD is pulling away upwards from the signal line and if the price continues rising, it would cross into positive territory soon.

I suggested yesterday that "It is interesting to note that we might have seen the formation of a mini double bottom for SPH. Using $3.68 as the trough and $3.79 as the neckline does give us $3.88 as a target."  In such a case, after meeting the target, what happens next?  Using Fibo lines, we see $3.94 (123.6%) as the next resistance to watch.  If that goes, it would be $3.97 (138.2%).

However, the rather weak volume still bugs me and in the event of a correction, it remains to be seen if the 100dMA, now at $3.82, would serve as support. The upturning 20dMA has merged with the rising 200dMA and should provide a stronger support if tested.  This is at $3.74 now.

Related post:
SPH: A pleasant surprise.

FSL Trust: Verona I.

Initially, the news that FSL Trust secured the release of Verona I was met with much bullishness and price was pushed to a high of 40.5c on the back of heavy volume.  By the end of the day, it closed where it started the day at 38c, forming an inverted cross.  This suggests that there is still much bearish sentiment here.  Once Nika I is released as well, we might see the unit price of FSL Trust bottoming in earnest.


MFI has risen and is testing 50% next.  This suggests some positive buying momentum.  The OBV has turned up quite vigorously which suggests some accumulation activity. The downtrend is still quite obvious and until its unit price moves above the declining 20dMA, the worst is not over for FSL Trust.

Major resistance at 42c, as provided by the declining 20dMA.  Immediate support is at 37.5c.  The waters are still murky for FSL Trust but it might be clearing up.


Charts in brief: 17 Jun 2010.

Thursday, June 17, 2010

Healthway Medical: Second black candle day in a row and we see a sell signal in the MACD histogram.  MFI is turning down in overbought territory. An initial correction to 18c where we find the 38.2% Fibo line is not difficult to imagine.  Stronger support could be found in a band between 16.5c to 17c.


LMIR: Volume expanded nicely as price closed at 48c, avoiding another doji.  We will now need confirmation that 47.5c is resistance turned support. Negative divergence between price and volume although still visible has weakened somewhat with today's higher volume. In case 47.5c fails to hold as support, immediate support is at 47c followed by 46c.


Golden Agriculture:  55c is proving to be a tough resistance to overcome. Both the 50d and 100d MAs are providing resistance at that price. Today's black spinning top could serve as a reversal signal.  Will need confirmation. The negative divergence between price and volume is obvious. I would stay cautious and not go long here. Immediate support in case of further weakness is at 51.5c, as provided by the 200dMA.


Related post:
Charts in brief: 16 Jun 2010.

SPH: A pleasant surprise.

Sometimes, the unexpected happens in life and we can only hope that the unexpected happens to be a pleasant surprise and not a nasty one. After yesterday's doji on the back of higher volume, the white candle today on reduced volume was definitely unexpected and a pleasant surprise.  Could this continue tomorrow?  Your guess is as good as mine.


I see resistance at $3.82 next.  This is provided by the 100dMA. If this gives way, $3.88 is next, as provided by the 50dMA.  It is interesting to note that we might have seen the formation of a mini double bottom for SPH.  Using $3.68 as the trough and $3.79 as the neckline does give us $3.88 as a target.  Coincidence? Maybe.

Are we seeing the beginnings of an uptrend?  The MACD is rising in negative territory.  So, this could very well turn out to be a rebound in a downtrend and nothing more.  The negative divergence between price and volume is, this time, supported by a negative divergence between price and MFI.  This suggests that price has been rising on rather weak technicals in the last few sessions.

I would not buy more SPH at this point in time.  I would, in fact, sell some at $3.82 as a hedge and sell more at $3.88 if that is hit. I would keep an eye on the negative divergence to see if it gets corrected.  If it does, and if the MACD rises above zero into positive territory, more upside might be on the cards and I would hold my remaining shares for the ride up.  Good luck to fellow shareholders.

Charts in brief: 16 Jun 2010.

Wednesday, June 16, 2010

Golden Agriculture: Price rose and met resistance at 55c as expected. The falling 50dMA and 100dMA both approximate 55c which makes this a strong resistance.  If this could be taken out, we could likely see a target of 57.5c which is where we find the 138.2% Fibo line.  This is also a gap resistance.


AIMS AMP Capital Industrial REIT: The fourth gravestone doji in seven sessions.  21.5c is being tested vigorously as the immediate support. MACD has dipped into negative territory while the MFI and OBV have flattened.  The loss in buying momentum is obvious.


LMIR:  Second doji in a row as price closed at 47.5c, resisted by the flattening 50dMA. If this is taken out, resistance is provided by the falling 100d and 200d MAs. These are approaching 48c, which perhaps explain the dojis which reached a high of 48c.  The negative divergence between price and volume is obvious and suggests that LMIR is rising on weak technicals.


SPH: Volume expanded today and is the highest in seven sessions but all that could be managed at the end of the day was a doji with price closing at $3.75, suggesting weakness.  If price could rise further, it would find resistance at $3.82 as provided by the flat 100dMA.


Saizen REIT: I looked at the weekly chart just now. It seems that price is moving above the declining 100wMA.  This is good news.  There are of course two more days before the week ends.  So, let's see how it would end on Friday. I also like the up channel I see.


Related post:
Charts in brief: 14 Jun 2010.

CapitaMalls Asia: Triangle resolved.

CapitaMalls Asia's triangle has resolved itself to the upside, breaking resistance at $2.14, reaching a high of $2.18 before closing at $2.17.  Volume expanded nicely as well. The MACD has crossed into positive territory while the MFI formed a higher high.  The OBV has turned up slightly too.


Immediate resistance is at $2.19, an important support level created in February this year. The declining 100dMA is another resistance level at $2.21.  This coincides with another downtrend resistance line with its peak on 12 March 2010. So, the resistance band from $2.19 to $2.21 is likely to be a strong one. 

The rise in price today probably galls people who have cut their losses or taken profits earlier at lower highs but is a boon for people who have been holding on to their shares.  It is probably also tempting for some to go long now thinking that we are seeing the start of a new uptrend.

What do I think? Well, although volume expanded today, technically, I still see a negative divergence between price and volume.  This does not mean that price cannot go higher. However, the upside might be limited by the resistance band from $2.19 to $2.21. The MFI has been forming higher highs and higher lows and at 71.3% is not far from the overbought region.

Saizen REIT: Refinancing of loan from Soc Gen.

Tuesday, June 15, 2010

The Board of Directors of Japan Residential Assets Manager Limited, the manager (“Manager”) of Saizen Real Estate Investment Trust (“Saizen REIT”), wishes to announce that Godo Kaisha Choan (“GK Choan”), a TK operator of Saizen REIT, has entered into a facility agreement on
15 June 2010 with Societe Generale (the “Facility Agreement”) for the refinancing of its JPY 5.9 billion (S$90.2 million1) loan (the “Refinanced Loan”), which was originally obtained from Societe Generale and due to mature in July 2011. The completion of the Facility Agreement and related loan documents are subject to the fulfillment of the conditions precedent, such as the registration of mortgages of the properties.

The Refinanced Loan is for a term of 3 years up to 15 June 2013. The refinancing terms include the collateralisation of the property portfolios of two TK operators of Saizen REIT, namely GK Choan and Yugen Kaisha Kokkei (“YK Kokkei”), as security for the Refinanced Loan. The property portfolios of GK Choan and YK Kokkei are valued at an aggregate of JPY 11.8 billion (S$180.4 million) based on valuations as at 30 April 2010. The Refinanced Loan is non-recourse to Saizen REIT.

Although the Refinanced Loan is subject to a variable interest rate, GK Choan intends to enter into an interest rate swap arrangement to fix the annual interest rate on the Refinanced Loan throughout its term. Further details on the applicable interest rate will be announced when it is fixed. The Refinanced Loan also has an amortising feature with an initial principal repayment of JPY 140.5 million (S$2.1 million) in June 2010 and quarterly principal repayments of JPY 40.5 million (S$0.6 million) thereafter. Societe Generale will also charge an up-front fee of JPY 59.0 million (S$0.9 million).

The Management Team is pleased with the successful refinancing of this loan as it enables Saizen REIT to further strengthen its capital structure. Particularly, in view of recent financial turmoil in Europe, the risk appetite of international lenders has become less predictable. The Management Team deems it prudent to refinance this loan, which is Saizen REIT’s second largest loan, as soon as possible while the opportunity remains open. Other than the JPY 7.1 billion (S$108.6 million) loan of YK Shintoku (which is currently in maturity default) and the JPY 0.45 billion (S$6.9 million) loan of GK Chosei, Saizen REIT has no further loans that are due to mature in the next two financial years. This will allow the Management Team to focus on the refinancing of the loan of YK Shintoku.

Courage Marine: Triple bottom?

An old friend from University asked me out for dinner earlier this evening. We met up and he asked if there are any good penny stocks now to go long on.  Without hesitation, I asked him to look at Courage Marine.

Courage Marine has confirmed the long term support of 17.5c again and again.  Today, it broke resistance provided by the declining 20dMA at 18.5c.  This incidentally is a many times tested resistance level.  Closing at 19.5c, it is resisted by the declining 100dMA.  The way upwards might be difficult as three MAs have to be overcome.  Without an expansion in volume with any upward movement in price, it would be difficult to have a breakout.


However, in terms of chart pattern, Courage Marine might well be forming a triple bottom. If this reading is correct, the neckline is at 21.5c and the target is 25.5c.

I am currently vested in Courage Marine and might add to my position if it confirms that 18.5c is resistance turned support.  For anyone thinking of going long, 18.5c is a fair entry price.  The downside seems limited with the long term support at 17.5c.  The risk reward analysis provides an attractive proposition.

Related post:
Courage Marine: Riding the waves of recovery.


Monthly Popular Blog Posts

All time ASSI most popular!


Bloggy Award