The email address in "Contact AK: Ads and more" above will vanish from November 2018.

PRIVACY POLICY

FAKE ASSI AK71 IN HWZ.

Featured blog.

1M50 CPF millionaire in 2021!

Ever since the CPFB introduced a colorful pie chart of our CPF savings a few years ago, I would look forward to mine every year like a teena...

Past blog posts now load week by week. The old style created a problem for some as the system would load 50 blog posts each time. Hope the new style is better. Search archives in box below.

Archives

"E-book" by AK

Second "e-book".

Another free "e-book".

4th free "e-book".

Pageviews since Dec'09

Financially free and Facebook free!

Recent Comments

ASSI's Guest bloggers

Cache Logistics Trust: A retest of 91.5c low?

Wednesday, March 2, 2011

This is one counter I have been patiently waiting for price to reach a level I consider relatively attractive. Technically, it is looking quite possible that my wish could come true.


Today's trading volume is the highest since 1 Nov 2010. A long black candle was formed. Coupled with increased volume, this is very bearish. We could see the recent low of 92.5c tested next. Could we even see the low of 26 May 2010 at 91.5c tested? There is a chance.


I have put in my buy queue at 91.5c. With an annualised DPU of 7.76c, it would mean a distribution yield of 8.48%. This is lower than AIMS AMP Capital Industrial REIT's 9.76% (with a DPU of 2c at the current price of 20.5c).

A lower distribution yield is acceptable to me due to the REIT's much lower gearing of 23.7% and much higher interest cover ratio of 9.3x. Cache Logistics Trust's numbers look stronger than AIMS AMP Capital Industrial REIT's (gearing of 33.6% and interest cover ratio of 5x). Buying at 91.5c is still a premium of 2.8% over its NAV/share of 89c but this is marginal and acceptable for a lower risk investment.

Related post:
Cache Logistics Trust: Weakness after XD.

Healthway Medical: 4Q 2010 results.

Not expecting any spectacular improvement in numbers from Healthway Medical. Let's take a look:

1.  Revenue declined 23.8% in Q4 compared to the same period last year.  For the full year, revenue declined 12.2% compared to the previous year.

2. Staff cost increased 11% in Q4 compared to the same period last year.

3. Profit before income tax decreased 68.2% to $1.133m in Q4 compared to the same period last year.

4. Cash flow from operations is positive for the quarter at $6,289m. This may seem like a good thing but scrutinise the numbers and we realise that most of this is because of trade and other receivables which came up to $6,927m. If we take these away, cash flow from operations would be negative.
 
5. EPS for the quarter is 0.04c which is an improvement over the 0.01c in Q3 but down from 0.23c in the same quarter last year. Full year EPS 0.14c.

See results here.


Although the numbers are still bad, generally, the numbers are getting less bad. The increase in staff cost seems to be slowing down while the reduction in profit is not as severe as before. Even the negative cash flow from operation situation is less serious now as compared to negative $2.3m in Q2 and negative $1.278m in Q3.

With an EPS of 0.14c, Healthway Medical is trading at a PE of 100x. No investor worth his salt would touch this. However, there could be opportunities to trade this counter and I would view any rebound as a chance for stale bulls to reduce exposure.


Immediate support is at 13.5c but if this were to break, we could see 12.5c next. Strong support is to be found at 11c. Technically, the only encouraging sign is the MFI which shows some underlying support with higher lows.

So, if we do not see a sell down tomorrow, it would suggest that only stoic long holders are left. In fact, from the peak achieved on 16 June 2010, volume has been declining as share price retreated. No matter how dismal the fundamentals are, if all the sellers have sold, share price could begin to bottom in earnest. Wait and see.

Related post:
Healthway Medical: 3Q 2010 results.

CapitaMalls Asia: More upside after gap cover?

Tuesday, March 1, 2011

Some may wonder why CapitaMalls Asia seems to be suffering from malaise even as Capitaland's share price recovered almost 3% today. A quick look at the chart and the answer is obvious. Gap resistance is found at $1.75 and the counter closed the gap today. What now?


The MACD histogram has turned green. With the MACD still in negative territory, a green histogram probably indicates a short term bullish bias. The MFI has dipped into oversold territory while the RSI is upturning in oversold territory. Even if the price does not recover in a hurry, the technicals hint that any downside could be limited for now.

Immediate support has been established at $1.69, the low of 28 Feb while immediate resistance remains at $1.75, beyond which, resistance could be found at $1.83 (a twice tested support turned resistance) and $1.88 (downtrend resistance and declining 20dMA).

Related post:
CapitaMalls Asia: Another failed reversal signal.

Golden Agriculture: A one day gain of 7 to 9.4%.

The STI experienced a nice up day as it closed 1.9% higher at 3,067.60. Golden Agriculture closed higher as well, breaking the immediate resistance of 68.5c, touching a high of 71c before closing at 70.5c.


I have closed my long position bought at 64c yesterday at 68.5c and 70c today, locking in a one day gain of 7% and 9.4% respectively. For those who have yet to close their positions, the next resistance levels are at 72c (100dMA) and 73.5c (50dMA). Having broken out of the downtrend which started on 4 Jan on the back of a high volume white candle day, there is a chance that price could go higher. Then, why did I choose to close my position?

A one day gain of 7% to 9.4%, risk free, is good enough for me. There could be another 2 or 3c gain from here but the risk is definitely higher now. 68.5c is also a natural price level for partial divestment as it approximates the position of the downtrend resistance, on top of being the price where we find the 20dMA.


A look at the weekly chart shows that 72c is likely to be a strong resistance. Notice also how the MFI and RSI are forming lower highs and lower lows. We could be experiencing a very strong rebound and when the energy is spent, price is probably heading lower.


Related post:

SoundGlobal: Sound the alarm?

Monday, February 28, 2011

On 27 Jan, I blogged about SoundGlobal and how I was, once upon a time, an investor in the company, when it was known as E-pure. I concluded that blog post by saying "I like to use Fibo lines in such an instance to see how low price could go in case support breaks. Support is, of course, at 70c. Looking at the chart, the three golden ratios are at 62c, 59.5c and 57c. Buy some at those levels? I might if the other signs are encouraging."


The counter closed at 61c today as price hugged the lower Bollinger. ADX has been rising sharply as the negative DI continues higher. More weakness is probable.

However, in case of a rebound, expect gap resistance at 67.5c and support turned resistance at 71c.

Fundamentally, the company's full year results announced today might have disappointed although a 1c dividend was declared.

Year on year, profit increased a mere 2.3% although revenue increased 36.5% and gross profit increased 42.8%. Expenses and income tax shot through the roof.

EPS: RMB 8.4c (Errata: RMB 22.4c)
NAV/share: RMB 149.5c

See announcement here.

So, will I buy at 61c? I think it is still pretty pricey with a PE of about 36x (Errata: 14.5x). I might still be suffering from the memory effect and 61c is just not an attractive price for me to go long on this counter again.

Errata: Made a mistake as I took in only Q4's EPS. At 14.5x, it doesn't look so pricey anymore.

Related post:
SoundGlobal: The former E-pure.

CapitaMalls Asia: Another failed reversal signal.

The Bullish Harami Cross failed as a reversal signal. Today, price gapped down at $1.73 and went on to touch an intra-day low of $1.69 before closing at $1.72. Very high volume accompanied this black candle day.

On the face of it, the entire picture looks very bearish but the formation of a black hammer suggests that the bulls are fighting back. In fact, the trade summary shows that sell downs and buy ups are almost evenly matched.


In an earlier blog post, I suggested that $1.70 is a strong support and that I would wait to see if this support level holds up before deciding whether to add to my long position. I have added to my long position at $1.71 today as the $1.70 level was tested and held up.


Related post:
CapitaMalls Asia: Another reversal signal.

Golden Agriculture: Stellar FY2010 results.

In my past blog posts on Golden Agriculture, I said that this company is the most leveraged to CPO price and the very strong CPO price in recent months naturally means higher profits for the company. Golden Agriculture reported stellar results for FY2010 today:

Year on year:

1. Revenue increased 53%.

2. Core net profit increased 91% (excluding gain from changes in fair value of biological assets, foreign exchange loss and exceptional items).

3. Net debt/equity ratio at 0.1x.

4. Dividend of 0.77c per share proposed.

5. NAV per share is US56c.

6. EPS is US12c.


See full presentation here.


The after market sell down of almost 10m shares at 65c is somewhat disconcerting. This notwithstanding, the immediate resistance to any continuing upward movement in price is provided by the descending 20dMA which would approximate 68.5c tomorrow. I went in this morning with a small long position at 64c. Let us see how things turn out tomorrow.


Saizen REIT: Insider moves and divestment of Aistage Ushita Minami.

Sunday, February 27, 2011

Catching up on my reading:

1. 21 Feb: Somerset Holdings Limited (SHL) converted 206,800 warrants into new units. 601,600 units held after the change. Mr. Dennis Lam Siu Sun, a director of the REIT, is the beneficial holder of more than 20% of the issued share capital of SHL.


2. 25 Feb: Divestment of Aistage Ushita Minami for a cash consideration of JPY 270,000,000 (S$4.2 million). Location: Hiroshima.  Built in August 2006, comprises 32 residential units and 7 parking lots. Sale price is a premium of approximately 0.7% to valuation.

Golden Agriculture: Immediate price target in a rebound.

On Friday, I mentioned that it is encouraging to see Golden Agriculture going above the 200dMA (currently at 63.5c) and wondered if breaking support earlier was just a whipsaw. So, is it time to go long here?


Well, the downtrend that started on 4 January is still intact. The MACD histogram shows a short term bullish bias. MFI and RSI are both turning up in oversold territories. The ADX is flattening which suggests that the downtrend has weakened although still in force.

If I were to enter for a quick trade, I would buy as close to the 200dMA (63.5c) as possible. In a downtrend, sell at resistance and the immediate resistance would be provided by the 20dMA which approximates the downtrend resistance at 69c. So, there could be a 10% or so upside.

The MACD is still declining in negative territory which suggests that any upward movement in price could just be a rebound. To err on the side of caution is probably prudent.

Related post:
STI up 1.8%: Out of the woods?

CapitaMalls Asia: Another reversal signal.

Saturday, February 26, 2011

Many would remember how the charts spotted reversal signals on Monday and how they failed to be confirmed on Tuesday. When reversal signals fail in a downtrend, the bear is strong indeed. With CapitaMalls Asia, it was no exception as a potential Morning Doji Star setup failed to materialise.

I have not really been looking at the charts since starting my vacation which explains the lack of any charts in my recent blog posts. This morning, I looked at CapitaMalls Asia's chart and we have a reversal signal again. It is a Bullish Harami Cross. Remembering that TA simply gives us hints of what could be and not what would be, let us look at the two possible scenarios.

On Wednesday, I asked "Would I sell my loss making investment in the company? Nope. Why? Because I think the selling could be overdone. Look at the weekly chart and you would see a positive divergence between price and the MFI and RSI."  So, if the reversal signal on the daily chart is confirmed next week, it could be a confirmation of the positive divergence on the weekly chart. This is the more exciting of the two scenarios for long holders, of course.


The $1.83 support would have to be recaptured and if this were to happen, there would be resistance at $1.88 next.  Price could go as high as $2.00 which is where we find the 200dMA but the declining 20wMA on the weekly chart will approximate $1.95 next week. So? We could see price touching $2.00 but pulling back to the 20wMA or $1.95 could be strong enough to prevent price from touching $2.00 at all. So, why am I saying all this? Knowing where the different resistance levels are allows me to decide on where to place my sell orders if the reversal does take place.

If the reversal signal failed once again, price could descend to test $1.70 which is a support level based on sets of Fibo lines I drew some time back on 18 Feb. This is the less exciting scenario for long holders. What would I do then? Wait to see that $1.70 holds up before deciding whether to increase exposure.

Time for breakfast and some sun. Have a great Saturday!

Related post:
CapitaMalls Asia: Morning Doji Star.
CapitaMalls Asia: Suppot at $1.88 gave way.

STI up 1.8%: Out of the woods?

Friday, February 25, 2011

The STI closed 1.8% higher and recaptured the 3,000 points support. Whether 3,000 points is now support once more, actually, needs confirmation. It is too early to say that we are out of the woods.

As most of my investments in the stock market are not index linked counters, I am not too bothered by the STI apart from the possible spillover effects it could create.

1. AIMS AMP Capital Industrial Trust: My buy queue at 20c was not filled. I am continuing the buy queue at 20c for next Monday. Although price closed at 20c today, most of the 8,840 lots transacted today were Buy Ups at 20.5c, 6,913 lots to be exact. 20c is a very strong support both technically and fundamentally.

2. Cache Logistics Trust: I am still waiting to buy this at 92.5c. It did touch 92.5c recently but my Buy order was not filled. So, am I going to buy at a higher price? Nope. I will continue to wait at 92.5c since technical weakness is still apparent.
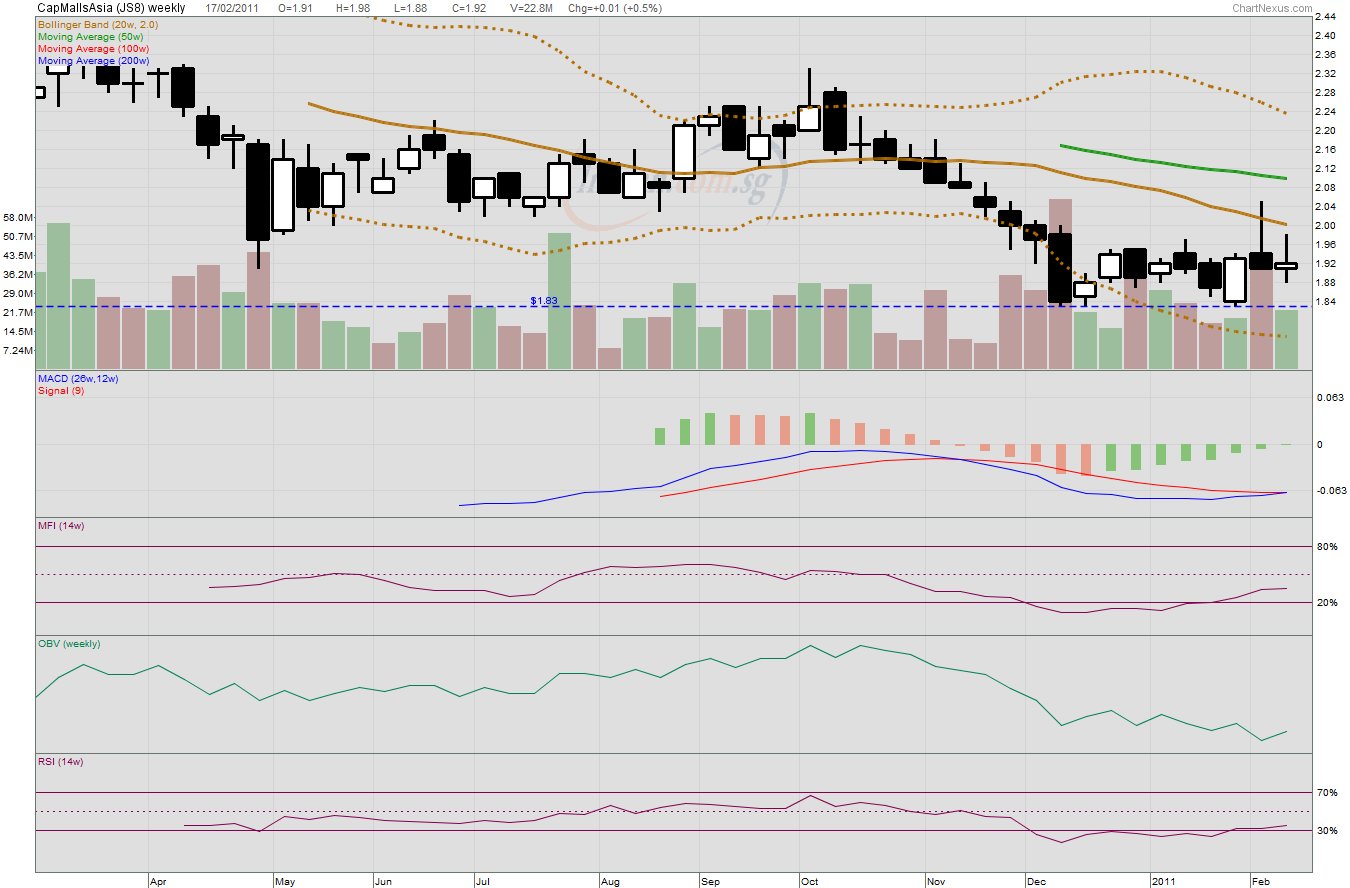
3. CapitaMalls Asia: Closed 1c higher. Technically very weak. See if it captures support at $1.83. The counter closed at $1.77.

4. First REIT: For anyone who is seeking exposure or increasing the weight of his long exposure to this REIT, 72c support has held up and could be a fairly safe entry. However, if 72c breaks, the next support is at 69c. If a possible 3c paper loss is acceptable, why not?

5. Genting SP: Similar to CapitaMalls Asia, this counter must capture its previous support in order to set investors' minds at ease. That would be at $2.00. The counter closed at $1.95.


6. Golden Agriculture: Regained support at 63.5c. This needs confirmation in the next session but it is a shot in the arm for investors. Closing below support recently could just be a whipsaw.

7. Healthway Medical: Closed at 14c which was support. This could now be resistance. Technically and fundamentally weak, I would only go long on this counter for quick trades for now which is what I have done before.


8. Saizen REIT: Buy ups at 16c happening. 15.5c remains a very strong support, technically, and is a fairly safe entry price for any interested investor.

9. ASTI: I increased my long position and I shared this on Twitter yesterday. EPS: 2.6c. NAV: 18c/share. Dividend: 0.7c/share. I bought more at 10c/share. It was my only "update" yesterday in my blog. If you are not following me on Twitter yet, you might want to do so for my short "blogs".

OK, hungry for dinner now after an afternoon nap, recovering from hours on the beach. Have a wonderful weekend! :)


STI soaked in red and AK71's thoughts.

Wednesday, February 23, 2011

I slept a full 8 hours last night! I also took a 2 hours nap in the afternoon today! Now, I am feeling drowsy from a very good dinner, a good facial treatment and a good massage. Yawn...

OK, a quick one:

1. CapitaMalls Asia: $1.83 support is gone. I remember saying that if this support goes, the next major support is probably at $1.70. $1.83 could be support turned resistance. Would I sell my loss making investment in the company? Nope. Why? Because I think the selling could be overdone. Look at the weekly chart and you would see a positive divergence between price and the MFI and RSI.

2. AIMS AMP Capital Industrial REIT: My buy order at 20.5c was filled this morning. I am now in the queue at 20c to buy more if the weakness continues. At 20c, the yield would be 10% per annum.

3. Cache Logistics Trust: Putting in a buy order at 92.5c. Nice chance of getting it filled. This is the lowest geared industrial property trust in Singapore right now, if I remember correctly.

4. First REIT: In an earlier blog post, I said there is probably a better time to increase exposure to this REIT and that price could retreat to 72c. It has done just that today. I am tempted to add to my long position at this price for a 9% yield per annum. However, I would not throw in the kitchen sink. Watch 72c which is supported by the 100dMA. If it goes, the 200dMA is at 69c and that is some way to fall.

5. Saizen REIT: 15.5c is where we find the rising 100wMA.  This is a very long term MA and likely to be a very strong support. For anyone waiting to enter or increase exposure to this REIT, this would be a fairly safe entry price.

6. Golden Agriculture: Breaking support provided by the 200dMA at 63.5c is very bearish. It needs confirmation to see if the 200dMA is now support turned resistance. The momentum oscillators are negative and we could see the 100wMA tested as support if this keeps up. Currently, it is at 54c.

I am having a hard time keeping my eyes from closing. So, that's all for tonight. Good night and good luck. :)

AK71 is on vacation!

Tuesday, February 22, 2011

In my last blog post, I mentioned that I had to catch a very early flight this morning and had to sleep early. Well, sleeping early is something very difficult for me and I didn't sleep very well last night.  If you are wondering what am I doing catching an early flight today, I am on vacation! Yes, finally!

I just woke up from a short nap and got connected to the internet a while ago. I have checked the stock market and saw, wow, a sea of red! It seems that the unrest in the Middle East and North Africa is shaking the global stock markets. I see prices of gold and silver climbing higher even as equities retreated.

This could be one of those opportunities to load up on counters with sound fundamentals. It could be a chance to make some value buys. This is the investor in me talking. However, the trader in me says that things could go lower and that we should wait to see supports holding up before increasing our long exposure. This is only sensible, is it not?

Which are the counters I am eyeing? Quite a few and here are three I am thinking of loading:

1. CapitaMalls Asia: Reversal signal failed to be confirmed, similar to most other counters' reversal signals. Keep an eye on the $1.83 support. See my earlier blog posts for more information.

2. AIMS AMP Capital Industrial REIT: 20.5c is holding up nicely as of now. I would probably put in a buy order tomorrow at 20.5c. Would definitely buy more at 20c, if ever tested. See my earlier blog posts for more information.

3. Cache Logistics Trust: I have been waiting for another chance to start a long position in this REIT. Touching 93.5c today, I might just be given a chance to buy a bid or two lower. See my earlier blog posts for more information.

Although I have internet connection in the hotel, I just realised that they use a different type of electrical plug from Singapore. I will have to see if I can get an adapter from a hardware store or supermarket. If I cannot find an adapter, you might not see me blogging for a while as my notebook's battery is running low on power.

Also, as I am on vacation, I might be somewhat lazy. It is only natural, isn't it? ;)

So, don't be surprised to see one liners or nothing at all. Hahaha... A vacation is a most uplifting must do for working adults. Despite a sea of red in the stock market, I am actually feeling quite happy. It could also be that most of my investment portfolio is for income. So, I am not so affected by the market weakness since capital appreciation is a secondary objective for me.

Till the next blog post, good luck to one and all. :)

CapitaMalls Asia: Morning doji star?

Monday, February 21, 2011

You might notice that many charts are spotting reversal signals today which are in need of confirmation. After so many days of down action, many counters seem ready for a rebound. Of course, signals will always need confirmation.

Regular readers would remember that I said I would wait to see if the $1.83 support for this counter would be retested. If the support held up upon retest, I might increase my exposure to the counter. Today, I increased the weight of my long position at $1.86. Why?

1. A lack of selling pressure as exemplified by the low volume.

2. The formation of a doji which is a potential reversal signal.

3. An uptick in the MFI and RSI which suggests some underlying support.


Taking point number 2 further, we could be seeing the first two candles in a three candles reversal pattern which is known as the Morning Doji Star. If price opens higher tomorrow and forms a white candle that ends the day at $1.90 or higher, the set up would be perfect. This set up usually signals a reversal from a downtrend.

Like I said before, TA is useful in giving us glimpses of what might be and not what would be. So, always be prepared for two scenarios.


If price goes up, what do we do? If we connect the highs of 9 Feb and 17 Feb, we get a trendline resistance. On the weekly chart, the resistance shows up as $1.92. On the daily chart, the resistance could be at $1.93 to $1.94. So, in a downtrend, sell at resistance. What about retaining some shares to see if there is a chance of price retesting the 100dMA as resistance as it did on 9 Feb? Why not? This would approximate $2.00 this week and coincides with the upper Bollinger band on the daily chart.

What if price did not go up and went down instead? In such an instance, I would wait to see if $1.83 would be retested as support and if it held up upon retest, I would buy more.

That's all, folks. I have a very early flight to catch tomorrow and I am going to try to sleep earlier. So, this is the only blog post for tonight. Good luck and good fortune.

Related post:
CapitaMalls Asia: Support at $1.88 gave way.

At what age to start investing in the stock market?

Sunday, February 20, 2011

A blog post at Bully the Bear has generated much interest and discussion: The youth and the stock market.

Although I have some ideas of my own, I was feeling lazy and didn't want to comment but a cboxer, Evolution of the "lobster taller than small girl , ak's t shirt older than evo" fame, put me in the hot seat and asked "Ak , whats ur view on LP's new post".

I said that I have introduced my 9 year old niece to investing in the stock market. Yes, she is in primary 3 this year. She has some savings in the bank which is paid a paltry sum of interest. 0.2% per annum for young savers? Maybe it is more, I am not very sure but still paltry.

Anyway, she has some shares in SPH for more than a year now bought using my account and she has collected one year's worth of dividends. It is quite a lot of money for a 9 year old and she's happy with the dividends, needless to say.

Getting dividends from investing in SPH has demonstrated to my niece the power of delayed gratification. 

By not using her savings on things she wants to buy and by investing for income, she is able to use the passive income to buy the things she wants later on without touching her savings at all. 

I heard from my sister that my niece is very frugal these days and I heard from my mom that my niece would sometimes ask her what's the latest share price of SPH.

Sound ideas in personal finance and investment, I believe, should be taught to children as soon as they are able to understand them. Teaching them the importance of thrift and savings is but the first step. How to make their savings work harder? 

Now, that's a big second step.

I remember how I would save all my pocket money when I was a boy in order to buy the toys I wanted. 

If only I had someone to tell me I should save all my money and how to make my money work harder for me then.

Related posts:
1. Teaching young children financial literacy.
2. Little book that beats the market.

Tea with AK71: Mahjong RubiksCube.

I had lunch with an old friend whom I have known for more than 20 years. As we grow older, we grow more sentimental, perhaps. After lunch, I decided to walk into a shop selling comics and knick knacks. It is a shop I enjoyed going to frequently in my younger days. Just when I thought there's nothing interesting enough for me to buy, this caught my eyes!


The RubiksCube was first introduced when I was in primary school, I think. See how it has evolved? Amazing! My friend opened his, I scrambled it up and he tried to put it back together again. It is much more difficult compared to the old cube with solid colors.

We have to make sure that the 6 sides each has the correct family of symbols AND the symbols have to be in sequence if numbers are involved (as in the TONG ZI, WAN ZI and TIAO ZI) AND the right side up (this applies to all sides, the other three sides being HONG ZHONG, BAI BAN and FA CAI)! Wah!


A small detail on the packaging caught my eyes too. Why does one say for ages 3 to adult and another, ages 8 to adult? Hmmm... Maybe, I am not smart enough to comprehend this. Made in China, where else? ;p

Tea with AK71: $1.20 Ice Kachang.

Saturday, February 19, 2011

Recently, while chatting in LP's cbox, Isaac mentioned Ice Kachang at some food centre priced at $1.50 a bowl. Some said that's cheap and that Ice Kachang costs $2.00 or $2.50 these days. Really?

I said I like the Ice Kachang at Tiong Bahru Market.  It is only $1.20 a bowl! Where to find? Tian Tian Yuan Dessert Garden, Tiong Bahru Market. Haha.. I went there for a bowl of the said Ice Kachang this evening and took some photos with my trusty Samsung phone camera:


I like Tiong Bahru Market. It is bright, airy and clean. You get a glimpse of the market here in the background:


These are photos of the Ice Kachang after I have mixed it up. Some would eat up all the ice first but I can't do it. I would get severe brain freeze!


How many attap chee? Three! Quite generous, I feel. Of course, lots of corn and lots of chendol as well!


Feel like having an inexpensive dessert, Singapore style? You know where to go. :)

Courage Marine: A dividend of 0.71c per share.

On 18 January, Courage Marine gapped up as it opened at 22c. My overnight sell queue was filled as I reduced my exposure to the counter by half. At the time, I said "The BDI has already broken the previous low and it is yet unclear where the next low would be but with greater increase in bulk shipping capacity in the near future, upside could be limited as supply outstrips demand." Recently, the BDI has found another low and has turned up:


In its press release, Courage Marine's management said that "Based on the report from Deutsche Bank on Feb 9, 2011, the BDI may experience a possible turnaround from current low level and is expected to return to normal in 1 to 2 months’ time." I expect normal to mean 2,500 or so but that would still be a lower high. The future for bulk carriers looks difficult indeed if this were the case.

I also said that "I would hold on to see if price could go higher either through further developments in its plan to dual list in Hong Kong or through a possibly generous dividend payout." Well, a dividend of 0.71c per share has been declared. Not too spectacular although it represents a dividend payout ratio of 83% based on the net profit after tax.

What would I do now? Sell into strength, if the opportunity presents itself.

See press release here.

Related posts:
Courage Marine: Dual listing.
Courage Marine: Retreating to support.

CapitaMalls Asia: Support at $1.88 gave way.

Friday, February 18, 2011


The immediate support at $1.88 gave way today as price closed at $1.87. I have a faint suspicion that on top of a lack of buying interest, there were also people who did not want to hold on to a long position over the weekend. Whatever it could be, price weakness was on the back of similar volume as the session before. A sell down without heavy volume but a sell down nonetheless.


The MACD has completed a bearish crossover with the signal line and dipped into negative territory. The MFI and RSI both dipped below 50%. My long positions taken at $1.92 and $1.88 are underwater. A retest of the low of $1.83 is not improbable. What would I do? Add to my position?


I would add to my position only if the support at $1.83 holds up . If that support breaks, using a few sets of Fibo lines, the next major support could be at $1.70 and that is some way to fall.

Related post:
CapitaMalls Asia: Full year FY2010 results.

AIMS AMP Capital Industrial Trust: Weekly chart.

I am going to plant some nightmarish thoughts in your head about AIMS AMP Capital Industrial Trust's unit price. Anyone who has been following my blog would know that I like this REIT for its high yield and how I think that risks are minimal what with the management refinancing at lower interest rates of 2.1+% and having no loans due until 2014. Even with the latest acquisition and share placement, the REIT's numbers remain healthy and I have estimated a mildly diluted DPU of 2c. At 21.5c, that is a distribution yield of 9.3%. Also, remember that this DPU is estimated based on managment distributing 97% of the REIT's distributable income against some other REITs which distribute 100% of their distributable income. OK, sounds good. Where is the nightmarish thought?


Look at the weekly chart. See the black candle formed this week and on much higher volume to boot? See how the MACD plunges towards zero and how the MFI is already in oversold territory? The OBV and RSI have similar bearish stories to tell.

On 15 Feb, I said that "I, however, am not entertaining any grand delusions that price might not weaken further once the counter goes XD. Using Fibo lines gives us a clue as to where the supports would be next. 20.5c is where we find 123.6% and 20c is where we find 138.2% as well as 150% (which is at 19.8c). As both 38.2% and 50% are golden ratios, I expect 20c to be a very strong support level if ever tested." Well, I am happy to report that the 21c has been holding up admirably and I still believe that my decision to buy in at 21c was right. The purchase would also be entitled to an advanced DPU of 0.285c.

So, would price weaken next week? I truly do not know but the possibility exists. The next distribution in June would probably see a DPU of 0.215c (0.5c - 0.285c) at the most although I suspect that it would be lesser as the income contribution from Northtech would take some time to kick in. So, with 11% more units in issue from the placement and if contribution from Northtech would not kick in till the next quarter, I expect the DPU in June could be 0.215/111 x100 = 0.1937c. Not very attractive? A reason for selling? Perhaps.

As I am investing in this REIT for income for the longer term, believing that its attractive yield is sustainable, I am not shaken by any short term fluctuations. If unit price were to test 20.5c or 20c, I am buying more.

Related post:
AIMS AMP Capital Industrial REIT: Oversold.

Golden Agriculture: 200dEMA shattered.

This is a daily chart using the 200dEMA. The support provided at 66c didn't stand a chance and was shattered. Closing on high volume at 65c, the 200dMA at 63.5c could be tested next. If that breaks, we could see this counter's share price diving. Where would be the supports then? 


One look at the chart suggests that supports could be found at 61c and 58.5c.  58.5c? Yes, that was where Golden Agriculture gapped up on 11 Oct 2010 and that gap could be covered eventually. Sounds horrifying for people who went long near the top? You bet.

What would I do if I were in their shoes? Well, prices go down a river of hope. Rarely do they go down in a straight line. There would probably be rebounds and when these happen, former supports would become resistance. Selling at resistance in a downtrend is the thing to do.

In the meantime, I will continue waiting for clearer signs of a reversal, if any.

Related post:
Golden Agriculture: In full retreat.


CapitaMalls Asia: Full year FY2010 results.

Thursday, February 17, 2011

A good set of numbers overall. Anything negative? Well, judging by the less than enthusiastic response from market participants, the proposed dividend of 2c per share probably failed to impress.

Although the share price of CapitaMalls Asia has been relatively resilient compared to other counters in the STI in the recent sell down, the outflow of funds from emerging markets is probably a dampener on its performance too. I received the following in my mailbox today:

For YTD 9-Feb-2011 there was a funds outflow of US$ 4.7 billion from Emerging Markets (China – US$ 2.19 bn; India – US$ 0.98 bn), with China and India accounting for 67% of the total funds outflow. The USA was the main beneficiary with net inflow of US$ 23.61 bn. [Source: EPFR Global, Data as at 9-Feb-2011].


The presentation slides are comprehensive and what I like about them the most is the candid manner in which the management shared the lessons learned from their 1st generation through 3rd generation malls in China. Although CapitaMalls Asia has malls in Singapore, Malaysia, India and Japan too, the largest market would still be in China eventually and they plan to have as many as 100 malls in China within the next 3 to 5 years.  Already 5 more malls would be completed in 2011. The management is now able to replicate their successful model in other parts of China quickly and reap returns at a faster pace.

See presentation slides here.

What about the technicals?  One look at the candlesticks and we would get the shivers. A bearish engulfing candle. Not good. However, notice the very long lower wick? This suggests some bullish buying which helped to push the counter to close at $1.92 which is where we find the 50dMA. It does not, however, change the fact that the bears have won the day.


I next look at the momentum oscillators.  The MACD's uptrend is still intact and it is still in positive territory although it does look like it could be making a bearish crossover with the signal line soon. The MFI and RSI have both turned down and are testing 50% as support. The mild upward bias of the MFI since the low of 31 Jan suggests that there is some demand and support for the counter.

What would I do? If price were to move higher, market participants who were waiting to sell at $2.00 like I was would sell into strength and, very likely, resistance such as $1.98 would become tougher to crack. Basically, a lowering of expectations would make lower resistance levels stronger. Of course, if these were to break, price could fly. I would set my sell orders at resistance. No surprises there.


What if the price moved lower which could very well happen? Taking a peek at the weekly chart, the MACD is still in negative territory but it is on the verge of forming a bullish crossover with the signal line. The MFI and RSI have both risen out of their oversold territories. Having said this, it is amply clear that the longer term downtrend is still intact. $1.83 could just be a floor.

There is one session left tomorrow before the weekly chart is complete but if price were to retest $1.83 successfully a second time round, I would expect strong buying interest from market participants.

Related post:
CapitaMalls Asia: Buy signal.

Golden Agriculture: In full retreat.

I last blogged about Golden Agriculture on 31 January and I mentioned that "TA is not about having a crystal ball and knowing exactly what would happen but TA is useful in that we would know exactly what to do if something happened.  So, in case price moved higher to 73c, I would reduce my long position. In case price moved lower, I would wait for it to go closer to the 200dMA at 63c before adding to my long position. That's my plan."


The counter's share price did move higher in subsequent days to test the trendline resistance and even whipsawed out to touch a high of 75c before retreating once more. Have you reduced your long position?

When to go long again? Well, if you believe that the outflow of funds from the emerging markets to developed markets is a temporary phenomenon and if you believe that crude palm oil will cost more in 2011, buying into Golden Agriculture at lower levels makes sense.  The 200dMA is now at 63.5c while the 200dEMA which gives greater weightage to more recent prices is at 66c. I could tiptoe into the stock then.

Tiptoe? As the overall technical picture is still rather bearish with the formation of a lower high as well as a most certain lower low, any long position without a definite picture of positive divergence is a hedge at best.

Related post:
Golden Agriculture: Resistance at 100dMA.

Tea with AK71: My Samsung mobile phone.

I have shared on my blogs some photos taken with my trusty Samsung mobile phone camera. Some readers have asked me for the model number of my phone as they would like to get one too. I looked but there is no model number stated on the phone. It just says "5.0 Mega Autofocus" on the back.

How did I get this phone? Well, my sister was wondering what to get for my birthday in 2009 when I suggested that she get a free phone from her telco when she re-contracted that year. That phone was my birthday present.


For those who are still interested in getting the same phone I have, here are some photos of the phone. I borrowed a digi cam to take these. I hope these photos help in your search. Waiting for a white color iPhone4? My phone is white too!

Oh, the picture of the back of the phone has a piece of paper which was intentionally placed there to block a sticker on the phone. My little secret. ;-)


Monthly Popular Blog Posts

All time ASSI most popular!


Bloggy Award