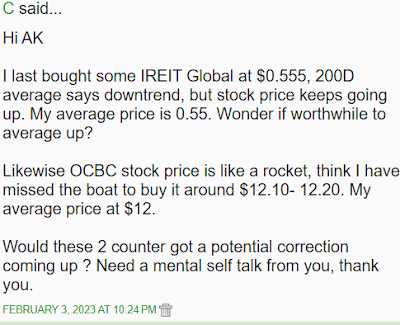
This blog is in response to a reader who asked if he has missed the boat for OCBC and IREIT Global?
It feels like it has been some time since I had a blog like this.
Very rare.
If you like such blogs, hope you enjoy this one.
AK says to reader:
OCBC's chart shows a strong upward momentum in the MACD but the MFI shows that it is borderline overbought. Testing resistance now at $13 and if it fails to break resistance, the immediate support is at $12.50 which is provided by a rising 50 days moving average.
A stronger support is the longer term 200 days exponential moving average which is now at $12.15 but as it is still rising, at this point, this support price will move higher over time.
 |
| OCBC's chart. |
Likewise, IREIT Global's chart shows a strong upward momentum in the MACD but the MFI has dipped and is no longer in overbought territory which gives it a bit more room to move higher with less resistance.
Unlike OCBC, however, IREIT Global's 200 days moving average is still declining but very slightly so which means it is unlikely to be a strong support although this is where IREIT Global's price is currently sitting.
In a relatively buoyant market, to be fair, even a weak support is more likely to hold.
If this support breaks, then, the rising 50 days moving average should provide the next support which, at this point, is at 52 cents.
As this support is rising, it is likely to be relatively strong even though it is a shorter term moving average.
It is also interesting to note that the 50 days moving average formed a golden cross, a bullish crossover with the flattening 100 days moving average in the middle of January.
 |
| IREIT Global's chart. |
In summary, both OCBC and IREIT Global's charts show that they have emerged from their multi months bottoming process and they are unlikely to retest their October 2022 lows anytime soon.
As usual, remember that technical analysis is about probability and not certainty.
More importantly, mental AK is just talking to himself, as usual.
Recently published:
1. Bankruptcies & property auctions...
1. Bankruptcies & property auctions...


