The email address in "Contact AK: Ads and more" above will vanish from November 2018.

PRIVACY POLICY

FAKE ASSI AK71 IN HWZ.

Featured blog.

1M50 CPF millionaire in 2021!

Ever since the CPFB introduced a colorful pie chart of our CPF savings a few years ago, I would look forward to mine every year like a teena...

Past blog posts now load week by week. The old style created a problem for some as the system would load 50 blog posts each time. Hope the new style is better. Search archives in box below.

Archives

"E-book" by AK

Second "e-book".

Another free "e-book".

4th free "e-book".

Pageviews since Dec'09

Financially free and Facebook free!

Recent Comments

ASSI's Guest bloggers

FSL Trust: Time to buy?

Tuesday, June 1, 2010

FSL Trust has moved above its most recent downtrend resistance on 27 May and has established an uptrend support since it bottomed at 42.5c on 21 May with a white spinning top.  That white spinning top has delivered as a reversal signal, it would seem.

The MACD has crossed above the the signal line in negative territory.  MFI has formed a higher high after being resisted at 50%.  OBV has stopped declining.  All the technicals suggest that downward pressure has eased and that its price might now be basing.


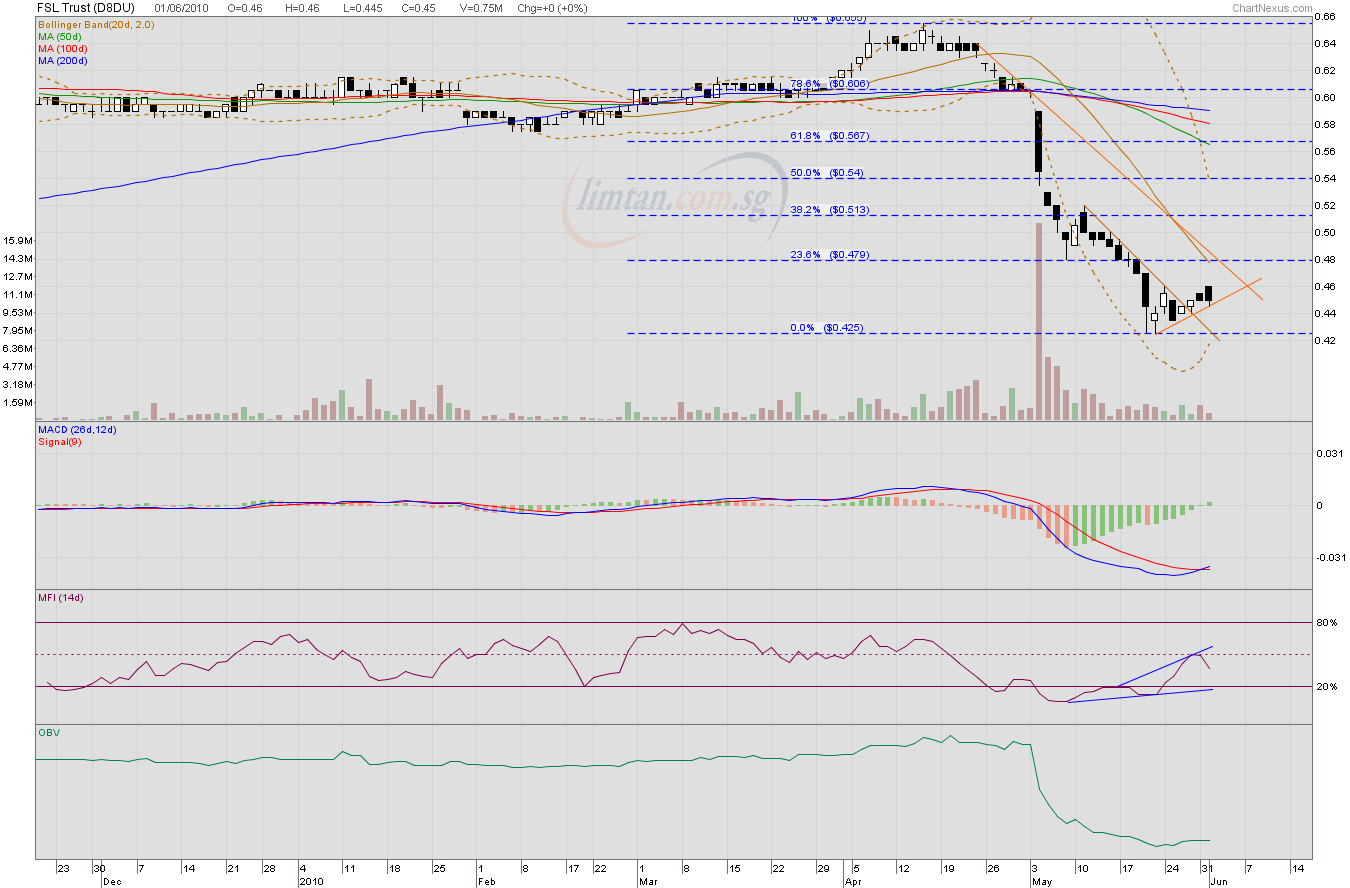
Should we buy some now? As a hedge, maybe. We have to bear in mind that price has been rising recently on very low volume.  If price starts declining again soon, we would have a lower high formed and we want to see that 42.5c is not tested again (in which case, it would form a higher low) or, if it is tested, it should hold up (in which case, it might form a double bottom).  If 42.5c breaks as support, a new lower low would be formed, which is bearish.  Then, the MACD's bullish crossover in negative territory would have just been signalling a rebound and not a more bullish reversal.

So, I might hedge with a smallish long position but I would only buy more if I see clearer signs that price has bottomed and that it is recovering.

Related posts:
FSL Trust: A sinking ship?
FSL Trust: That sinking feeling.

LMIR: Up against a wall?

Monday, May 31, 2010

LMIR staged an up day as well but on rather lacklustre volume. Price hit a high of 47c before retreating to close at 46c. 47c is a many times tested support and could be a strong resistance now.  For those who wish to, it is a good price to reduce exposure at. Price could touch a high of 47.5c for this REIT tomorrow and the downtrend would still be intact.

However, the momentum oscillators are encouraging with MFI forming a higher high and the OBV continuing to rise. The MACD looks like it would do a bullish crossover with the signal line in negative territory.  Let's see what tomorrow brings.


My strategy in a downtrend: Sell into strength as price rebounds to test resistance. Buy more when price shows signs of bottoming or when the trend shows signs of reversing. Bearing this in mind, I would queue to sell some at 47.5c, the trendline resistance, tomorrow


Monthly Popular Blog Posts

All time ASSI most popular!


Bloggy Award