The email address in "Contact AK: Ads and more" above will vanish from November 2018.

PRIVACY POLICY

FAKE ASSI AK71 IN HWZ.

Featured blog.

1M50 CPF millionaire in 2021!

Ever since the CPFB introduced a colorful pie chart of our CPF savings a few years ago, I would look forward to mine every year like a teena...

Past blog posts now load week by week. The old style created a problem for some as the system would load 50 blog posts each time. Hope the new style is better. Search archives in box below.

Archives

"E-book" by AK

Second "e-book".

Another free "e-book".

4th free "e-book".

Pageviews since Dec'09

Financially free and Facebook free!

Recent Comments

ASSI's Guest bloggers

Showing posts with label FSL Trust. Show all posts

FSL Trust: An Asset Play with 80% discount to NAV?

Sunday, April 27, 2014

FSL Trust was an investment in my portfolio that I considered to be a mistake and I blogged about it a few times before. I collected quarterly dividends when I was vested and I also made some money by using technical analysis to trade the stock but, overall, the investment performed badly.

However, always bearing in mind what Peter Lynch said, I looked at FSL Trust again as its unit price plunged to about 6c a unit before recovering to about 10c recently after its trading suspension was lifted. All investments are good at the right prices. So, the question is whether FSL Trust is now at the right price.

Going through the latest annual report with numbers correct as of 31 Dec 2013, there seems to be plenty of optimism with a dose of caution on the part of the management. They took on more impairment to more accurately reflect the values of the assets held by FSL Trust and they also bought units in the open market as the price plunged, believing that the future of the Trust is now brighter.


Looking at the numbers, however, I believe that FSL Trust, at the moment, is attractive only as an Asset Play. With a NAV/unit of US$0.41 and a unit price of about S$0.10, it is trading at more than 80% discount to valuation. However, we have to bear in mind that ships are depreciating assets. So, their values have been and will continue reducing.
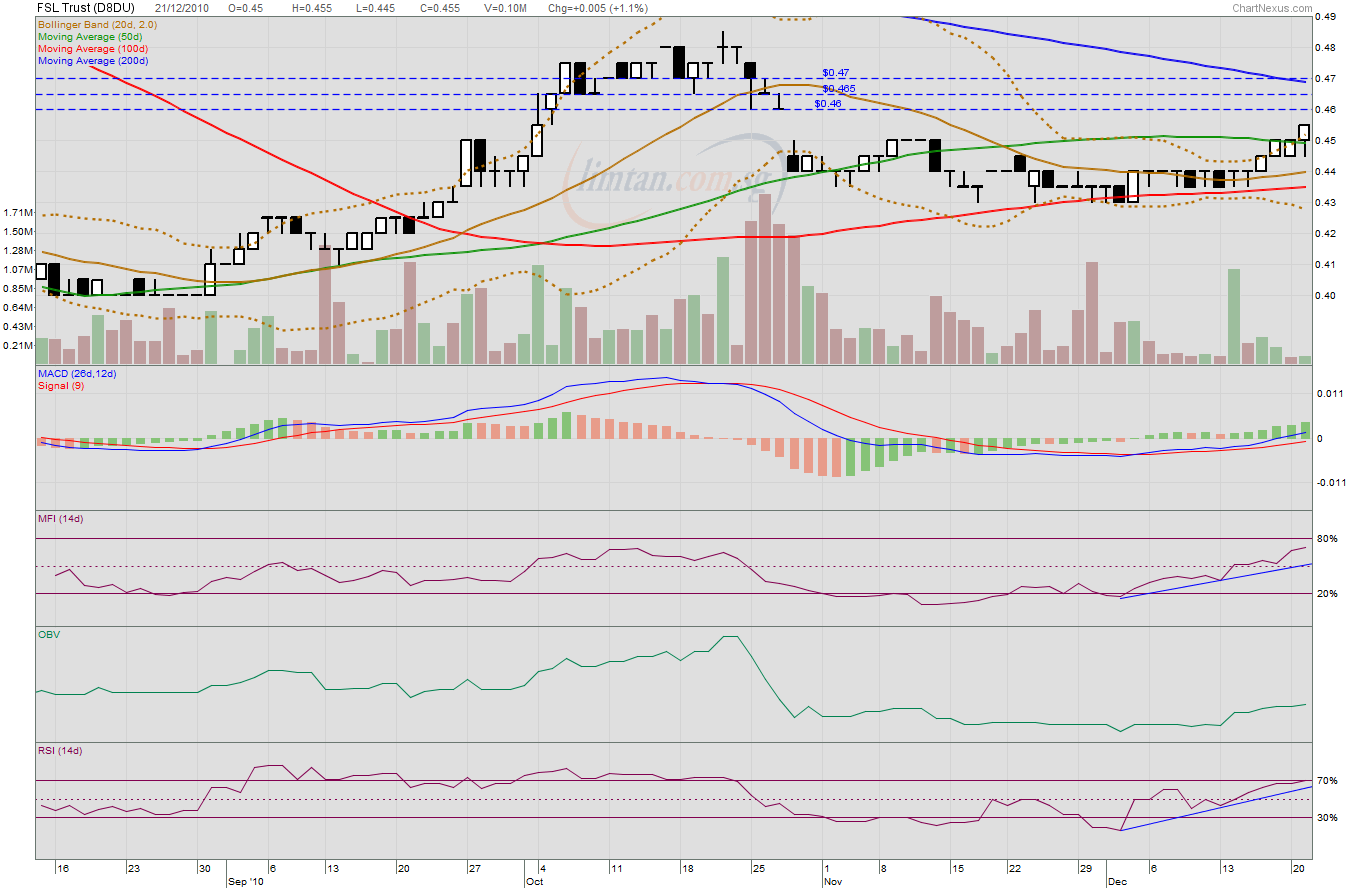


Click to enlarge.


When Peter Lynch invested in Asset Plays, he asked:

1. How much debt is there? This is important because creditors are first in line.

2. Is the company taking on new debt, making the assets less valuable?

3. Is there a raider in the wings to help shareholders reap the benefits of the assets?


To address the questions:

FSL Trust's NAV/unit of US$0.41 suggests that if the ships were to be sold at 20% discount to their book values now, after paying off all debts, we could see S$0.25/unit distributed to unit holders. This is a huge 150% premium to current unit price.

FSL Trust is not taking on new debt. In fact, it has been paying down its debt.

In recent months, we have seen some analyses on how the shipping cycle could be bottoming although conditions are still difficult. If these analyses are correct, then, could there be a corporate raider or two who might be eyeing a possible Asset Play like FSL Trust?


With revenue already in decline and with more charters expiring, possibly not to be renewed, FSL Trust is unattractive as an investment for income at the moment or even in the next 12 to 24 months.


Even if FSL Trust were to resume a quarterly distribution of US$0.001, at S$0.10 a unit, we will get a distribution yield of about 5% only. For an investment with assets depreciating at about 5% per annum and with useful life of 25 years when newly acquired, a distribution yield of 5% per annum is sorely inadequate.

Without any improvement or deterioration in revenue, FSL Trust will take about 16 years to pay off the bank loans. 16 years is a long time and given the relatively short useful life of ships, as income generating assets, they would be more or less spent by then.

Of course, one could argue that it is unrealistic to assume zero improvement in economic conditions in that same period. Indeed, FSL Trust could become a compelling investment for income again if its revenue were to improve significantly.

To continue, at the end of the hypothetical 16 years, taking into consideration depreciation and if we are somewhat conservative, FSL Trust's portfolio of assets could still give us a NAV/unit of US$0.20. So, if no corporate raider came along, for someone who decided to invest in FSL Trust at 10c a unit today, he could possibly see a capital gain of 150%, all else remaining equal, if the ships were to be sold away at book value then. Is this realistic?

This leads us to another question we have to answer and that is how realistic are the valuations of the assets? FSL Trust has already taken on more impairment but will there be more to come? More impairment could happen if shipping rates were to decline again. Experts are of the view that this is unlikely to happen as the global economy improves ever so slowly.


For investors for income, FSL Trust is a rather poor choice now and in the near future. As an Asset Play, however, it could be rewarding. However, we wouldn't know whether the unit price will reflect more closely the value of the underlying assets and, if it should happen, when.

Remember that the assets are depreciating in nature. So, the longer we hold, the lower their values. As I would like to be compensated adequately while I wait, I will need a much higher distribution yield than 5% from FSL Trust before considering re-initiating a long position, all else remaining equal. What about 10% which was what Rickmers Maritime Trust offered a year ago during its 1 for 1 rights issue, all else remaining equal?

Bearing in mind that all else will not remain equal and that things could get worse with expiring charters, investors attracted to FSL Trust as an Asset Play should demand an even higher distribution yield. Therefore, without any chance of revenue improving in the near future, as an Asset Play, FSL Trust will become attractive only at a unit price that is much lower than what it is today.


Suggested reading:
"One Up On Wall Street"
by Peter Lynch.
The last I checked, they have 7 pre-owned copies left at US$6.98 each. Free shipping worldwide.

Related posts:
1. Rickmers Maritime Trust: 1 for 1 Rights Issue.
2. FSL Trust: Sold some at 48c.
3. FSL Trust: Reduced DPU to US 0.10c.

FSL Trust: Reduced DPU to US0.10c.

Friday, January 20, 2012

Mr. Market is showing displeasure with FSL Trust's decision to reduce quarterly DPU from 0.95c to 0.1c. Its price has plunged more than 20% from the closing of 30c yesterday to 23c when I last looked.


Assuming an exchange rate of US$1 to S$1.30, the annualised distribution yield is about 2.2% per annum based on a unit price of 23c. Better than fixed deposit rates but as an investment, it is not very attractive.

However, I believe that this development together with the Trust's recent successful refinancing with a 6 year amortising loan are steps in the right direction. If the Trust survives the difficult times ahead, it could emerge stronger and ready to ride the next upswing in the cycle.

Read press release: here.

FSL Trust: Private placement.

Thursday, June 9, 2011

On 2 June, I blogged about FSL Trust's acquisition of a vessel and I was wondering if it would be a positive catalyst for its unit price since distributable income would likely increase.  Read blog post here.

Fast on the heals of that acquisition is another one. This time, "the acquisition will be fully funded by the drawdown of US$23 million from the trust's existing revolving credit facility and US$23 million in cash - with around US$15 million to come from a private placement of up to 57 million new FSL Trust units." Read full article here.

So, although distributable income would likely increase, distribution per unit might not increase much since there is a private placement involved. The new units would be issued at a discounted price of 35c/unit and represent 8.6% of the total number of units in issue after the placement exercise is concluded.

Read announcement here.

FSL Trust: Acquisition.

Thursday, June 2, 2011

Nothing much has been happening to FSL Trust lately although its unit price has suffered from weakness. I suspect that the weakness of the US$ and the shipping sector as a whole could have been a dampener.

The latest news is an acquisition of a "Long Range II (LR2) product tanker from TORM Singapore, a wholly-owned subsidiary of TORM A/S for US$46 million ($56.7 million).... The transaction will be immediately cash flow accretive to the trust and will increase the trust’s total remaining contracted revenue to US$602 million, excluding extension options. The average remaining lease term of the trust’s portfolio will also remain at the current 6.8 years."

Will this be a positive catalyst enough to send its unit price higher?


FSL Trust: 4QFY10 results.

Wednesday, January 19, 2011

I have been divesting my stake in FSL Trust as its unit price strengthened in recent weeks. The last time I sold some was at 48c on 7 January, less than a fortnight ago. Then, I said "My long position in FSL is for a trade and the entry was not based on fundamentals, which are lacking. So, reducing my long position, locking in gains at resistance and at signs of weakening demand, at least partially, is prudent although it could limit gains in case of further price appreciation."

Despite what the management says, the Trust's numbers are really weak as it reported its results today and the following should cause some concern:

1. Reduction in net cash from operations which reduced year on year by 19.6% and quarter on quarter by 7.8%.

2. A full year net loss of US$5.67million whereas it registered a profit of US$8.42million the year before.

3. A loan tranche maturing in April 2012.

See Press Release here.


Technically, volume has been rising as price stayed in a tight trading range between 47c and 47.5c mostly. 48c was only tested in three sessions. Today, volume was very thin as a BUY signal appeared on the MACD histogram. The 20dMA has been rising and is now at 47c while the 50d and 100d MAs are rising to meet the declining 200dMA. Golden crosses in the making? Perhaps. The MFI, however, has turned down after hitting 50% which acted as resistance. The overall picture is one which suggests further upside in the current time frame could be limited.

FSL Trust released its results after 8pm tonight. So, it remains to be seen how the market would react tomorrow. If the support provided by the 20dMA at 47c should break, stronger support could be found at 45c which is where the 50d, 100d and 200d MAs are approximating. I would sell into strength and 48c is the resistance to watch.

Related post:
FSL Trust: Sold some at 48c.

FSL Trust: Sold some at 48c.

Friday, January 7, 2011

Yesterday, I reduced my long position in FSL Trust at 48c, locking in some gains. You might remember that I sold some on 30 Dec at 47c. Then, I mentioned that "In a benign situation, I expect gap resistance at 46c to become support in the near term. This is further strengthened by the uptrend support line. Technically, the worst seems to be over for FSL Trust and a retest of resistance at 48.5c looks likely in time." 48c is just one bid away from 48.5c and selling some at 48c is a hedge in case price weakens.


A doji was formed yesterday, suggesting indecision, while the uptrending MFI broke its support when it emerged from the overbought territory a day earlier. Encouraging though some technicals might be with the MACD continuing to rise and the OBV showing no signs of distribution, the RSI was way overbought.

My long position in FSL is for a trade and the entry was not based on fundamentals, which are lacking. So, reducing my long position, locking in gains at resistance and at signs of weakening demand, at least partially, is prudent although it could limit gains in case of further price appreciation.


Today, 48c remains the resistance as a gravestone doji was formed. The stalemate between bulls and bears is obvious but it seems as if the bulls are tiring. Further upside seems difficult and could be limited to a retest of the high of 48.5c touched on 21 Oct 10. A pull back would see immediate support at 46c which is also where the 20dMA is rising to form a golden cross with the declining 200dMA.

Related post:
FSL Trust: Sold some at 47c.

FSL Trust: Sold some at 47c.

Thursday, December 30, 2010

I shared on 21 Dec that I had an eventual target of 47c for FSL Trust, saying that it would close the gap at 46c which it did on 23 Dec. Gap resistance was later taken out on 29 Dec. As price opened at 47c today, my overnight sell queue was partially filled. Could we see the 21 Oct high of 48.5c tested next?


With the MFI and RSI both in overbought regions, further upside from the current level could prove difficult. Although momentum is clearly positive as suggested by the rising MACD in positive territory, the light trading volumes as price rose suggest a lack of sellers and not an abundance of buyers. Sustainability is in question.

In a benign situation, I expect gap resistance at 46c to become support in the near term. This is further strengthened by the uptrend support line. Technically, the worst seems to be over for FSL Trust and a retest of resistance at 48.5c looks likely in time.

Related post:
FSL Trust: Closing the gap soon?

FSL Trust: Closing the gap soon?

Tuesday, December 21, 2010

On 17 Dec, I mentioned that "The MACD is about to cross into positive territory. OBV suggests continuing accumulation. MFI and RSI are both rising, suggesting strengthening demand and buying momentum."


The resistance provided by the 50dMA at 45c was taken out today as price closed at 45.5c. With the MACD rising into positive territory, we could indeed see the gap closed at 46c next. Eventual target remains at 47c.

Related post:
FSL Trust: Testing 45c resistance.

FSL Trust: Testing 45c resistance.

Friday, December 17, 2010

FSL Trust is rising on pretty modest volume. It closed at 45c which is the resistance provided by the 50dMA today. Could it move higher?


I suggested that the counter could close the gap at 46c which could indeed happen. The Bollinger Bands are beginning to widen after squeezing tighter and tighter in the recent past. This usually hints of a break from a tight trading range and could have some momentum.

The MACD is about to cross into positive territory. OBV suggests continuing accumulation. MFI and RSI are both rising, suggesting strengthening demand and buying momentum. If this keeps up, we could see the declining 200dMA, currently at 47c, as the eventual target. Immediate support is at 44c.

Related post:
FSL Trust: Higher volume and testing resistance.

FSL Trust: Higher volume and testing resistance.

Tuesday, December 14, 2010

Volume expanded today as price action formed a dragonfly doji. This is promising. The MACD has been rising above the signal line, although it is doing so in negative territory. The MFI has formed higher lows which suggest positive demand momentum. The OBV has turned up, suggesting that we are seeing some accumulation activity.


The 100dMA seems to be providing immediate and strong support with the Bollinger bands narrowing. A precursor of a breakout? Perhaps. Immediate resistance is at 44c and, in the event of a breakout, the eventual target is where we find the declining 200dMA, which is currently at 47c. Before that, expect resistance at 45c, the flattening 50dMA, and 46c, gap resistance.

Related post:
FSL Trust: Approaching target.

FSL Trust: US0.95c DPU.

Friday, October 22, 2010

FSL Trust has declared a DPU of US0.95c, payable on 26 November 2010. The EDGE has a good write up and the following provides some solace to unitholders worried about the early termination of charters by Groda for the two ships:

"Revenue for 3Q FY10 declined 4.9% year-on-year (y-o-y) to US$23.4 million compared to US$24.6 million in 3Q FY09. The 3Q FY10 revenue includes freight revenue of US$2.5 million earned by the vessels FSL Hamburg and FSL Singapore deployed in the product tanker spot market during the period.

"This mitigated the loss of bareboat charter lease rentals of US$3.8 million for the quarter due to the premature termination of bareboat leases for FSL Hamburg and FSL Singapore."

The decline in overall revenue is expected but it was not as bad as feared. This could possibly explain the strengthening unit price of the trust over the last couple of months.

Technically, it seems that price has hit resistance at 48c.  Could the rising 20dMA give a much needed nudge for price to move higher?  Could the more benign news plus income distribution be positive catalysts?


OBV has been gently rising which suggests that some quiet accumulation has been taking place. MFI, with its higher lows, suggests sustained demand.  Indeed, we could see the MFI decline a bit more to retest 50% and the uptrend would still be intact. MFI is a function of price and volume. So, a slight decline in price or volume or both would see it coming down.

The declining 200dMA should provide a rather strong resistance at 50c in the event of a further upmove in price. I would do a partial divestment if unit price should rise to that level.

Related post:
FSL Trust: Approaching target.


FSL Trust: Approaching target.

Wednesday, October 6, 2010

On 9 August, I said that "I also have some units which I bought in the recent crash. Why? I explained that the purchases were made based on TA and are for a trade. Looking at the charts, FSL Trust's price has not just found a floor, it has most probably bottomed.  So, would I sell at the bottom?  No." and that "From a FA perspective, it is true that FSL Trust has very high risks and its propects seem bleak in the longer term but would it go belly up in the next few months? Rather unlikely as the world economy is still on the mend and the fortunes of the shipping industry are looking up."

On 4 October, I said "46c is still the resistance to watch although it was briefly taken out today on higher volume. Eventual target remains defined by the descending 200dMA, currently at 50.5c."


Today, a white candle was formed as price closed at 47.5c.  46c could possibly be resistance turned support and we are a step closer to the eventual target. MACD has been rising in positive territory. MFI has formed higher lows and higher highs. Things are looking benign. However, volume is lacking suggesting that a lack of sellers rather than an abundance of buyers is the reason behind the price appreciation. This puts into question the sustainability of the recent buoyant price action.

Related posts:
FSL Trust: Where to from here?
FSL Trust: Challenging resistance.

FSL Trust: Challenging resistance.

Monday, October 4, 2010

On 27 Sep, I mentioned that "Trading above the gap which was closed at 43.5c now brings the next resistance at 46c to play.  I see an eventual target as defined by the descending 200dMA, currently at 51c."


FSL Trust has been experiencing buoyant price action since then and 43.5c has been established as immediate support.  This is likely to be underpinned by the rising 20dMA. 46c is still the resistance to watch although it was briefly taken out today on higher volume. Eventual target remains defined by the descending 200dMA, currently at 50.5c.

Related post:
FSL Trust: Rising from the depths.

FSL Trust: Rising from the depths.

Monday, September 27, 2010

It has been a while since I looked at FSL Trust. Today, it rose decisively.  Price action formed a wickless white candle, opening at 43.5c and closing at 45c. However, lacking in volume, one wonders if it would go on rising.


The rising 20dMA recently formed a golden cross with the 100dMA and this marks a strong support at 42c. Trading above the gap which was closed at 43.5c now brings the next resistance at 46c to play.  I see an eventual target as defined by the descending 200dMA, currently at 51c.

Related post:
FSL Trust: Where to from here?
FSL Trust: The skies are clearing up.

FSL Trust: Where to from here?

Monday, August 9, 2010

I have blogged about how a past decision to invest in FSL Trust was a mistake. Over time, I have discovered more reasons why FSL Trust is a high risk investment and how, in the long run, it is doomed to fail as it is operating based on a flawed business model.

An article, Shipping Trusts: A closer look, 13 July 2010, in Next Insight says it well:

"... problem arises when the trust managers market the trust as a going concern, but then pay out cash as if the trust were self liquidating ... This misleads investors who think that the high payouts are sustainable and do not realise that part of the cash received is a return of capital...

"Until recently, FSLT paid out 100% if cash generated and did not pay down its debt. This essentially made the trust behave like a self-liquidating vehicle, regardless of any management claims to the contrary."

I know of at least two blog masters who have liquidated their investments in FSL Trust recently at a loss: Mike Dirnt and Musicwhiz, admitting that their investments were mistakes.  JW of Wealthbuch almost put some money in FSL Trust just before the recent crash from 60+ cents based on the posts by Grandmaster89 in an investment forum. Grandmaster89 has become more grounded in his views since. More recently, Alvis of A Investor bought some units at a price close to the bottom at 30+ cents based on TA.

I still have units in FSL Trust bought at $1 in the early days, probably at about the same time Musicwhiz bought his units.  I have been thinking of divesting these units but was not as deft as Mike Dirnt to divest at >60c at the recent high; nor did I divest last week like Musicwhiz at a rather much lower price.

I also have some units which I bought in the recent crash. Why? I explained that the purchases were made based on TA and are for a trade. Looking at the charts, FSL Trust's price has not just found a floor, it has most probably bottomed.  So, would I sell at the bottom?  No. 


In fact, the low formed on 11 Jun at 36c would be a strong support if price does decline to that level again.  Market participants would remember that price as the low and they could have made some money if they had bought more then.  More likely, however, the recent many times tested support at 37.5c would act as an effective breakwater in case of a decline. What about the upside? For now, it seems that the price could remain trapped in between the 20d and 50d MAs for a while. These assumptions are valid as long as everything else in FSL Trust's business remains constant.

From a FA perspective, it is true that FSL Trust has very high risks and its propects seem bleak in the longer term but would it go belly up in the next few months? Rather unlikely as the world economy is still on the mend and the fortunes of the shipping industry are looking up.

Related post:
High yields: Successes, failures and the in betweens.
Charts in brief: 26 Jul 10.

Charts in brief: 26 Jul 10.

Monday, July 26, 2010

Genting SP: Volume expanded today as price closed at $1.24.  The MACD seems poised to do a bullish crossover with the signal line. Momentum is looking good and one wonders if $1.20 is now resistance turned support. Needs confirmation. However, if one looks at going above $1.20 as a breakout, this is a very "quiet" breakout with rather modest volume. Is it durable?


CapitaMalls Asia:  Downtrend intact with today's black candle. OBV has formed a lower high, suggesting ongoing distribution activity. The descending 20dMA is preventing further gains. We could be seeing the beginnings of a descending triangle pattern if the downward pressure continues. Immediate resistance at $2.06 and immediate support at $2.02.


FSL Trust: Results were announced today with 2Q FY10 DPU at US0.95¢.  Volume rose today and there was much selling down of its units.  In spite of this, price remained unchanged at 42c.  This is a sign of strength as it means staying above the 50dMA.  MFI continues to rise, suggesting increased demand.  OBV is rising, suggesting continuing accumulation. There is some underlying support for this counter.  20dMA continues to rise and we might be in for a golden cross with the 50dMA soon.


SPH: The MFI has broken its uptrend support, suggesting a weakening demand. This coupled with the MACD set to do a bearish crossover with the signal line, a retracement to the 20dMA cannot be ruled out.  This is currently at $3.95 which is also an important candlestick resistance turned support. Volume has been reducing as price pulled back.  This is good news for bulls.  Support at $4.00 seems shaky and if this goes, I would keep an eye on $3.95 to see if it holds up as the next support.


FSL Trust: Golden cross?

Saturday, July 24, 2010

FSL Trust formed a white candle in the last session with a respectable expansion in volume. The 20dMA continues rising and seems on track to form a golden cross with the 50dMA in the near future. Although we do not see a buy signal on the MACD histogram, the MACD is, nonetheless, rising in positive territory. The MFI has been rising which suggests a rising demand.  The OBV is rising again which suggests continual accumulation.


If price were to stay at 42c in the next session or, in fact, go higher, the resistance provided by the 50dMA would be taken out.  The next target is then 43.5c if price does a gap fill which it probably would.  Beyond that, a retest of the high of early June at 46c is next.

Related post:
FSL Trust: The skies are clearing up.

Charts in brief: 20 Jul 10.

Tuesday, July 20, 2010

AIMS AMP Capital Industrial REIT: Volume expanded strongly today as price closed at a high of 22.5c. This move breaks it out of a 0.5c trading range which started in early June. The MFI has broken out of its downtrend, suggesting a return of demand.  Sell signal on the MACD histogram negated as the MACD continues to rise in positive territory above the signal line. The OBV has moved to a new high, suggesting more accumulation than distribution has been going on in recent times. Whether price could break out of the bigger trading range of 20c to 23c remains to be seen. When all the sellers are done selling and buyers want a piece of the action, the only direction would be up.  The fundamentals are strong and the technicals are seemingly benign.  Let's see if the momentum keeps up.


FSL Trust: Price went above the resistance provided by the 50dMA briefly. Closing at 42c is still at resistance provided by the same MA. MACD has just crossed into positive territory. MFI continues to rise. These suggest a return of positive momentum and demand. However, the OBV is flat which suggests a stalemate between accumulation and distribution. Demand is rising but accumulation is not keeping pace which means that there is some selling pressure.  Without an expansion in volume with an upmove in price, the sellers are unlikely to be taken out. With the RSI high in overbought territory, suggesting that price has moved upwards too quickly, the possibility of a slow down or pullback cannot be ruled out. Immediate support remains at 40c while breaking out of 42c resistance could see price do a gap fill at 43.5c and, perhaps, test the lower high of 46c too.


Golden Agriculture: Touched 58.5c, the resistance identified last Friday. Volume shrank for two sessions in a row as price rose. So, price is rising from a lack of sellers, not an abundance of buyers. MFI and OBV continue rising, suggesting rising demand and accumulation.  So, we could perhaps see price moving higher.  If 58.5c is taken out, the next resistance is at 60c.  The MFI nears overbought territory and one wonders if there is much more left to this rally.  This is a valid concern when we see that the RSI is already in overbought territory.  Any pullback would see immediate support at 55c, as provided by the 100dMA.


Charts in brief: 16 Jul 10 (Part 2).

Saturday, July 17, 2010

FSL Trust: 42c seems like a difficult resistance to overcome at this point in time. This is gap resistance and resistance provided by the declining 50dMA at the same time. RSI has also moved higher up into the overbought region while we see a sell signal on the MACD histogram.  Volume has been reducing as price moved higher. Without an expansion in volume as price moves higher, it is unlikely that 42c could be taken out in the next session. Unless there is some positive newsflow soon, chances of a pullback in price are higher. With all the higher lows formed in the MFI and RSI, the momentum oscillators are clearly uptrending and I expect any pullback to find initial support at 40c.


Genting SP: First touched on 29 Jun, $1.20 has proven to be a tough nut to crack. Volume has been reducing since that day as price stayed above the 20dMA. If we look purely at the 20dMA, the short term uptrend seems to be intact. However, if we look at the MACD, we see a bearish crossover with the signal line on 2 Jul and since then the MACD has been declining beneath the signal line. MFI, RSI and OBV have all flatlined.  There is clearly no trend where these indicators are concerned.  Pay attention to the 20dMA which should be at $1.17 in the next session or so.  If this is breached, price could move lower rapidly.


Healthway Medical: Since price touched a high of 21c on 16 Jun, the MFI has been in decline.  This suggests a weakening demand. However, we do not see a similar decline in the OBV.  In fact, the OBV has gone up which suggests that there is more accumulation than distribution. There is some underlying support and even though demand has weakened, there is little selling pressure.  Immediate support is at 18.5c.


K-REIT: A very nice up day with a very nice white candle as volume more than doubled from the previous session.  Price closed at $1.22, the high of 11 and 12 Jan.  if momentum keeps up and price action goes parabolic, I won't be surprised if we see $1.34 (161.8% Fibo line). At this point in time, it is still a fantasy.


Related posts:
FSL Trust: The skies are clearing up.

FSL Trust: The skies are clearing up.

Sunday, July 11, 2010

Price stayed above the 20dMA in the last three sessions. The 20dMA, currently at 38.5c, is now resistance turned support. I decided to look at the 20dEMA as well.  The EMA gives greater weightage to recent prices and could sometime explain why price could not move past a certain point in the short term.  The 20dEMA is at 39.5c and seeing the price closed at 40c in the last two sessions is comforting.  However, the volumes were very low and the durability of the recent appreciation in price is questionable.  In fact, since a spike in volume on 18 Jun when the MACD made a bullish crossover with the signal line, volume has been reducing.


Let us look at some other technical indicators to gain more insights. The MACD is rising and pulling away upwards from the signal line in negative territory. The rising MACD is due to the upturning 20dMA, reversing its decline. Although this seems promising, the MFI has gone below its uptrend support due to the very thin volume in the last session as price stayed at 40c. Immediate demand seems to have reduced and some suspect that market participants are waiting for greater clarity.

Although the technicals are not totally inspiring, Mr. Market might spring a pleasant surprise on us and a further move upwards could see the gap filled at 43.5c which in the next session coincides with the declining 50dMA. Immediate support is a band from 39.5c to 38.5c. For anyone who wishes to buy into FSL Trust, technically, it would seem safer to do so now.

Related post:
FSL Trust: Above the 20dMA.


Monthly Popular Blog Posts

All time ASSI most popular!


Bloggy Award