The email address in "Contact AK: Ads and more" above will vanish from November 2018.

PRIVACY POLICY

FAKE ASSI AK71 IN HWZ.

Featured blog.

1M50 CPF millionaire in 2021!

Ever since the CPFB introduced a colorful pie chart of our CPF savings a few years ago, I would look forward to mine every year like a teena...

Past blog posts now load week by week. The old style created a problem for some as the system would load 50 blog posts each time. Hope the new style is better. Search archives in box below.

Archives

"E-book" by AK

Second "e-book".

Another free "e-book".

4th free "e-book".

Pageviews since Dec'09

Financially free and Facebook free!

Recent Comments

ASSI's Guest bloggers

Golden Agriculture: CPO price spiked 2.44%.

Thursday, July 15, 2010

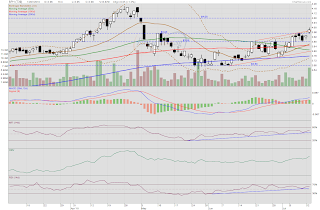
CPO price spiked 2.44% today to close RM58 higher at RM2,439.  The impressive appreciation aside, what is more significant is that the downtrend resistance established since the double top formation I have talked about before has been broken!  Is this the beginning of a sustained recovery or is the decline simply shifting to a lower gear?  Only time will tell.

Golden Agriculture's share price has yet to react to this bit of news or would it react at all?


From 26 April, we can draw two fan lines.  Price broke out of the first fan line resistance (in orange) and later on broke out of the second fan line resistance (in red). Since then, price seems to have moved into a range with resistance at 55c, provided by the flat 100dMA, and support at 52c, provided by the gently rising 200dMA.

Although the OBV is flattish, the MFI, which accounts for both volume and price, has broken out of its downtrend. So too has the RSI.  The halt in the decline of the MFI suggests that we are seeing a return in demand but this is probably balanced by the presence of sellers which is why the OBV is flattish. The dojis formed in the last two sessions suggest indecision and this reinforces the idea that we are seeing a delicate balance between the buyers and sellers here.

The MACD is gently rising in positive territory which indicates that the momentum is positive. So, although the current situation is still iffy, there is a slight upward bias observed. In the short term, the 100dMA resistance might be hard to break.  Look at the stochastics and we will see that it is entering overbought territory.  Upside could, therefore, be limited at 55c.

Fundamentally, if CPO price continues to recover while the share price of Golden Agriculture trades sideways, we might have an interesting proposition to go long here.  Buy in at 52c? Maybe. I am keeping an eye on this one.

Related post:
Golden Agriculture: Rebounding.

Saizen REIT: An update.

Wednesday, July 14, 2010

Saizen REIT has seemingly gone into hibernation.  For more than a month, its price has fluctuated between 16c and 16.5c. The daily MAs have all flatlined. Some may wonder if I am still interested in this REIT.  Well, I am still very much interested in this REIT.  It remains one of my top three investments in the stock market.  Regular readers of my blog would know that I believe it to be a very good investment with more than a fair bit of potential to deliver an attractive yield and possibly an even more attractive capital appreciation.


Today, the technicals are rather interesting.  Of course, with volume so thin, it could just be a mirage but let us do this just for fun, if nothing else. The MACD histogram shows a buy signal on a day that saw the formation of a dragonfly doji. The MFI, which has been impeded at 50% for some time, has finally risen above this resistance since falling below in late May. This suggests a strengthening demand, however slowly it took to develop. OBV is flat.  No obvious distribution or accumulation. In a rangebound situation, the stochastics could be telling and, now, we see it rising from the oversold region. 

There is only one word for investors of Saizen REIT: patience.  Those lacking in this virtue should not be vested in this REIT.  For the record, I have been vested since October last year.  I have done my FA and I believe this to be a gem.  I will continue waiting.  Patience, I believe, will be rewarded.

Related post:
Saizen REIT: CEO bought more warrants.

MIIF: Very high volume up day.

Tuesday, July 13, 2010

MIIF had a very high volume up day, forming an impressive white candle to close at 52.5c. In the last 12 months, the only time volume was higher was in October 2009.  MACD histogram has a buy signal as momentum oscillators turned sharply upwards. Immediate support is a band between 49.5c to 50c.  Drawing an uptrend support from the low of 44.5c hit on 7 Jun approximates the position of the 20dMA which establishes this MA as an important support to watch. Any upside targets? Using Fibo lines, 138.2% approximates a many times tested candlestick resistance at 55c.  So, I expect this to be a strong resistance.  If this is taken out, we could see price go higher to 56.5c, the 161.8% Fibo line.


SPH: BUY calls aplenty.

SPH: A slew of BUY calls from brokerages on the back of sterling results for 3Q10 sent the share price of SPH higher today. $3.95 resistance is now support. Up channel resistance has been broken. MFI and RSI continue their upward trends.  OBV shows continuing accumulation. Sell signal on the MACD histogram negated. Volume more than doubled as price touched a high of $4.00 today and closed 5c higher than the previous session at $3.98. Same question: $4.08? Looking more probable now. Punters who are considering a punt could possibly have an ideal entry point at $3.95 if this support is tested again.


Related post:
Charts in brief: 12 Jul 10.


Monthly Popular Blog Posts

All time ASSI most popular!


Bloggy Award