The email address in "Contact AK: Ads and more" above will vanish from November 2018.

PRIVACY POLICY

FAKE ASSI AK71 IN HWZ.

Featured blog.

1M50 CPF millionaire in 2021!

Ever since the CPFB introduced a colorful pie chart of our CPF savings a few years ago, I would look forward to mine every year like a teena...

Past blog posts now load week by week. The old style created a problem for some as the system would load 50 blog posts each time. Hope the new style is better. Search archives in box below.

Archives

"E-book" by AK

Second "e-book".

Another free "e-book".

4th free "e-book".

Pageviews since Dec'09

Financially free and Facebook free!

Recent Comments

ASSI's Guest bloggers

AIMS AMP Capital Industrial Trust: Weekly chart.

Friday, February 18, 2011

I am going to plant some nightmarish thoughts in your head about AIMS AMP Capital Industrial Trust's unit price. Anyone who has been following my blog would know that I like this REIT for its high yield and how I think that risks are minimal what with the management refinancing at lower interest rates of 2.1+% and having no loans due until 2014. Even with the latest acquisition and share placement, the REIT's numbers remain healthy and I have estimated a mildly diluted DPU of 2c. At 21.5c, that is a distribution yield of 9.3%. Also, remember that this DPU is estimated based on managment distributing 97% of the REIT's distributable income against some other REITs which distribute 100% of their distributable income. OK, sounds good. Where is the nightmarish thought?


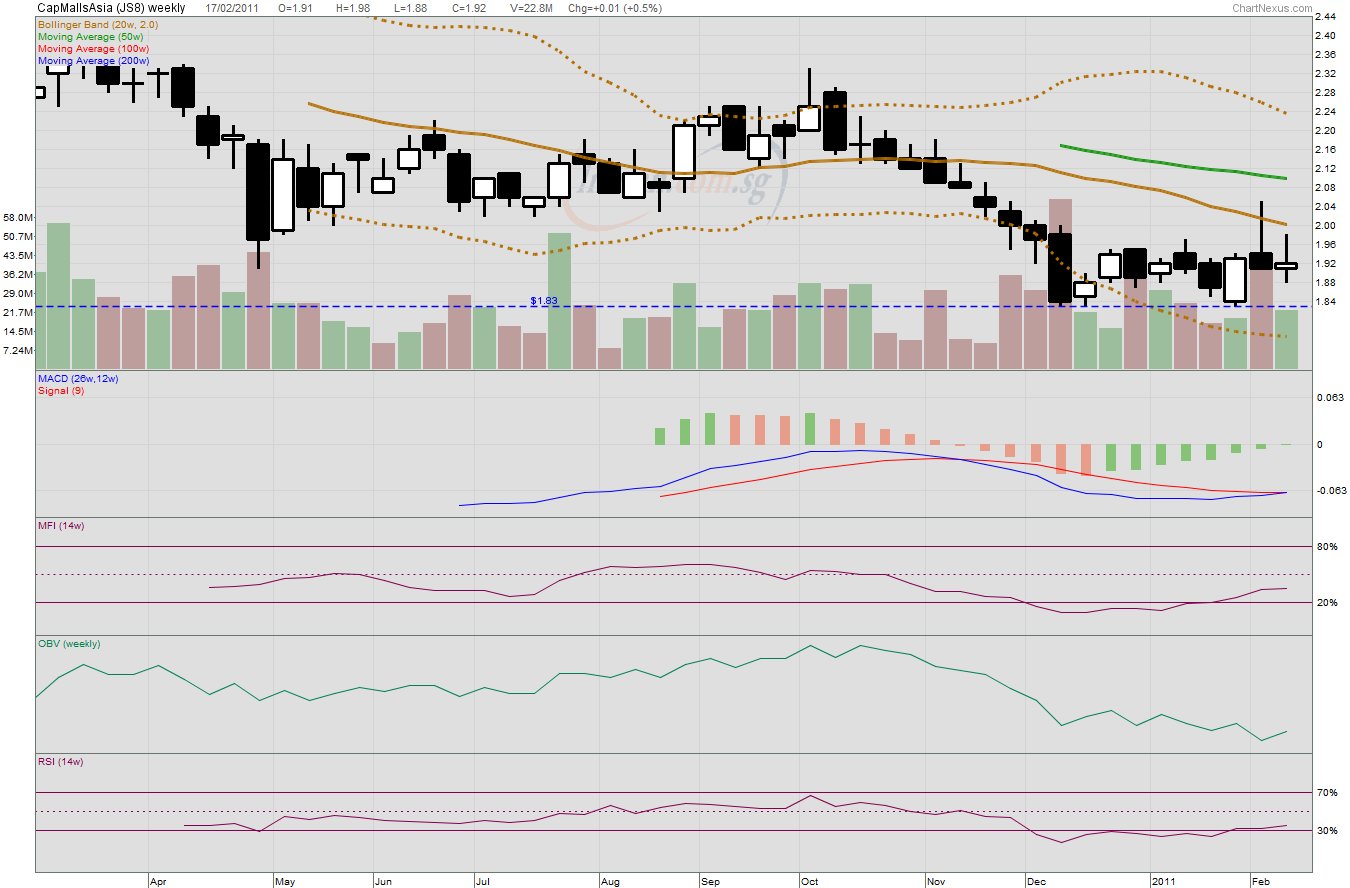
Look at the weekly chart. See the black candle formed this week and on much higher volume to boot? See how the MACD plunges towards zero and how the MFI is already in oversold territory? The OBV and RSI have similar bearish stories to tell.

On 15 Feb, I said that "I, however, am not entertaining any grand delusions that price might not weaken further once the counter goes XD. Using Fibo lines gives us a clue as to where the supports would be next. 20.5c is where we find 123.6% and 20c is where we find 138.2% as well as 150% (which is at 19.8c). As both 38.2% and 50% are golden ratios, I expect 20c to be a very strong support level if ever tested." Well, I am happy to report that the 21c has been holding up admirably and I still believe that my decision to buy in at 21c was right. The purchase would also be entitled to an advanced DPU of 0.285c.

So, would price weaken next week? I truly do not know but the possibility exists. The next distribution in June would probably see a DPU of 0.215c (0.5c - 0.285c) at the most although I suspect that it would be lesser as the income contribution from Northtech would take some time to kick in. So, with 11% more units in issue from the placement and if contribution from Northtech would not kick in till the next quarter, I expect the DPU in June could be 0.215/111 x100 = 0.1937c. Not very attractive? A reason for selling? Perhaps.

As I am investing in this REIT for income for the longer term, believing that its attractive yield is sustainable, I am not shaken by any short term fluctuations. If unit price were to test 20.5c or 20c, I am buying more.

Related post:
AIMS AMP Capital Industrial REIT: Oversold.

Golden Agriculture: 200dEMA shattered.

This is a daily chart using the 200dEMA. The support provided at 66c didn't stand a chance and was shattered. Closing on high volume at 65c, the 200dMA at 63.5c could be tested next. If that breaks, we could see this counter's share price diving. Where would be the supports then? 


One look at the chart suggests that supports could be found at 61c and 58.5c.  58.5c? Yes, that was where Golden Agriculture gapped up on 11 Oct 2010 and that gap could be covered eventually. Sounds horrifying for people who went long near the top? You bet.

What would I do if I were in their shoes? Well, prices go down a river of hope. Rarely do they go down in a straight line. There would probably be rebounds and when these happen, former supports would become resistance. Selling at resistance in a downtrend is the thing to do.

In the meantime, I will continue waiting for clearer signs of a reversal, if any.

Related post:
Golden Agriculture: In full retreat.


CapitaMalls Asia: Full year FY2010 results.

Thursday, February 17, 2011

A good set of numbers overall. Anything negative? Well, judging by the less than enthusiastic response from market participants, the proposed dividend of 2c per share probably failed to impress.

Although the share price of CapitaMalls Asia has been relatively resilient compared to other counters in the STI in the recent sell down, the outflow of funds from emerging markets is probably a dampener on its performance too. I received the following in my mailbox today:

For YTD 9-Feb-2011 there was a funds outflow of US$ 4.7 billion from Emerging Markets (China – US$ 2.19 bn; India – US$ 0.98 bn), with China and India accounting for 67% of the total funds outflow. The USA was the main beneficiary with net inflow of US$ 23.61 bn. [Source: EPFR Global, Data as at 9-Feb-2011].


The presentation slides are comprehensive and what I like about them the most is the candid manner in which the management shared the lessons learned from their 1st generation through 3rd generation malls in China. Although CapitaMalls Asia has malls in Singapore, Malaysia, India and Japan too, the largest market would still be in China eventually and they plan to have as many as 100 malls in China within the next 3 to 5 years.  Already 5 more malls would be completed in 2011. The management is now able to replicate their successful model in other parts of China quickly and reap returns at a faster pace.

See presentation slides here.

What about the technicals?  One look at the candlesticks and we would get the shivers. A bearish engulfing candle. Not good. However, notice the very long lower wick? This suggests some bullish buying which helped to push the counter to close at $1.92 which is where we find the 50dMA. It does not, however, change the fact that the bears have won the day.


I next look at the momentum oscillators.  The MACD's uptrend is still intact and it is still in positive territory although it does look like it could be making a bearish crossover with the signal line soon. The MFI and RSI have both turned down and are testing 50% as support. The mild upward bias of the MFI since the low of 31 Jan suggests that there is some demand and support for the counter.

What would I do? If price were to move higher, market participants who were waiting to sell at $2.00 like I was would sell into strength and, very likely, resistance such as $1.98 would become tougher to crack. Basically, a lowering of expectations would make lower resistance levels stronger. Of course, if these were to break, price could fly. I would set my sell orders at resistance. No surprises there.


What if the price moved lower which could very well happen? Taking a peek at the weekly chart, the MACD is still in negative territory but it is on the verge of forming a bullish crossover with the signal line. The MFI and RSI have both risen out of their oversold territories. Having said this, it is amply clear that the longer term downtrend is still intact. $1.83 could just be a floor.

There is one session left tomorrow before the weekly chart is complete but if price were to retest $1.83 successfully a second time round, I would expect strong buying interest from market participants.

Related post:
CapitaMalls Asia: Buy signal.

Golden Agriculture: In full retreat.

I last blogged about Golden Agriculture on 31 January and I mentioned that "TA is not about having a crystal ball and knowing exactly what would happen but TA is useful in that we would know exactly what to do if something happened.  So, in case price moved higher to 73c, I would reduce my long position. In case price moved lower, I would wait for it to go closer to the 200dMA at 63c before adding to my long position. That's my plan."


The counter's share price did move higher in subsequent days to test the trendline resistance and even whipsawed out to touch a high of 75c before retreating once more. Have you reduced your long position?

When to go long again? Well, if you believe that the outflow of funds from the emerging markets to developed markets is a temporary phenomenon and if you believe that crude palm oil will cost more in 2011, buying into Golden Agriculture at lower levels makes sense.  The 200dMA is now at 63.5c while the 200dEMA which gives greater weightage to more recent prices is at 66c. I could tiptoe into the stock then.

Tiptoe? As the overall technical picture is still rather bearish with the formation of a lower high as well as a most certain lower low, any long position without a definite picture of positive divergence is a hedge at best.

Related post:
Golden Agriculture: Resistance at 100dMA.


Monthly Popular Blog Posts

All time ASSI most popular!


Bloggy Award