The email address in "Contact AK: Ads and more" above will vanish from November 2018.

PRIVACY POLICY

FAKE ASSI AK71 IN HWZ.

Featured blog.

1M50 CPF millionaire in 2021!

Ever since the CPFB introduced a colorful pie chart of our CPF savings a few years ago, I would look forward to mine every year like a teena...

Past blog posts now load week by week. The old style created a problem for some as the system would load 50 blog posts each time. Hope the new style is better. Search archives in box below.

Archives

"E-book" by AK

Second "e-book".

Another free "e-book".

4th free "e-book".

Pageviews since Dec'09

Financially free and Facebook free!

Recent Comments

ASSI's Guest bloggers

Showing posts with label Marco Polo. Show all posts

Marco Polo Marine: The longer term picture.

Saturday, February 9, 2013

I have blogged about how the daily chart of Marco Polo Marine spots many negative divergences and how anyone who should go long at present would have to do so in a measured manner. This means not throwing in everything including the kitchen sink.

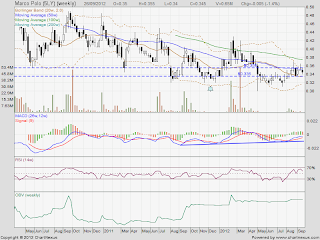
How big could a correction be if it should happen? Looking at the weekly chart, we see that share price could pull back to support at 36.5c which is where a golden cross has just formed as the 20wMA made a bullish crossover with the 100wMA.


42c to 36.5c? Wah! That is a 5.5c decline or a 13% fall. If that scares us, we should stay away. After all, it could happen. Look at the volume on the weekly chart and we will see how it has been declining as share price tried to push higher.

Then, why am I not selling?

I like to marry FA and TA. In an ideal situation for me, FA tells me if a stock is undervalued and TA tells me when to buy. It is also true that FA tells me if a stock is overvalued and TA tells me when to sell. Remember, these are ideals.

Technically, I observed how trading volumes in the two black candle weeks are much lower. They are much lower than volumes in the white candle weeks. This suggests to me that sellers lack conviction.

The MACD on the weekly chart is still rising. There is no let up in the positive momentum. OBV has been rising over the longer term which suggests that there is more accumulation than distribution going on.

Add the fact that the stock is still undervalued given Marco Polo Marine's numbers and prospects as well as comparison to peers, there isn't a strong case for me to sell. In fact, the case to continue accumulating on weakness is much stronger.

Related post:
Marco Polo Marine: Taking reference from trendlines.

Marco Polo Marine: Taking reference from trendlines.

Tuesday, February 5, 2013

I read somewhere before that a trader in the USA made a lot of money over the years using only trendlines in his technical analysis. Yes, only trendlines. Nothing else.


This hints at the importance of trendlines and how they have an indispensable role in anyone's charting efforts. After all, don't we hear people saying stuff like "the trend is our friend" and "don't go against the trend"? The word "trend" keeps popping up in technical analysis.

So, we must know how to recognise trends if we want to improve our chances of success trading in the stock market.

If we look at Marco Polo Marine, it is obvious that the downtrend was broken towards the end of 2012  and it is now on an uptrend.


Drawing trendlines, we would see that its current uptrend is in two parts: an earlier trendline with a gentler gradient which I have labelled "T2" and a later trendline with a steeper gradient which I have labelled "T1".

Drawing these trendlines, we know where are the price supports which must hold for the uptrend to remain intact. Breaking these supports would possibly be a sell signal for some. Short sellers could also come in to push the share price down further.

For others, it would represent opportunities to load up at cheaper valuations but we want to load up closer to supports. Well, at least for me, I think that buying at supports in an uptrend is the way to go.

Today, my overnight buy order at 41c was filled.

Related posts:
1. Marco Polo Marine: Negative divergences.
2. Recommended books for TA.

Marco Polo Marine: Negative divergences.

Friday, February 1, 2013

Although the fundamentals of Marco Polo Marine are sound and its future looks bright, Mr. Market is not known to respect fundamentals. Mr. Market is a creature of sentiments.

Technical analysis provides a window into the collective psyche of market participants and when there are negative divergences aplenty, we should exercise caution when thinking of initiating a long position or adding to a long position.


The presence of negative divergences does not mean that the share price will definitely weaken. It does not mean that the share price will not go higher. It just means that the risk of a retracement is now higher.

So, how do we respond to something like this?

Personally, I have not divested any of my shares of Marco Polo Marine. I am that confident of the company's prospects. In fact, if there should be a pullback to supports, I am likely to add to my long position.

So, is buying on pullbacks at supports a sure win strategy? Not at all. Supports could break and price could go lower! If that disturbs you, you might want to hold on to your money. However, if price should rebound and go higher, would you kick yourself if you had held on to your money?


If the fundamentals are sound, lower prices would present greater value. Why wouldn't we buy? The trick is in buying at supports and pacing ourselves as we do so. Don't throw in everything including the kitchen sink at the first support on retracement.

Some would say to wait for clearer signs of an upturn before adding to long positions. That, I feel, would work better in a downtrend. In an uptrend, buying at supports on pullbacks is what I would do. Go back one blog post and you would know what I mean.

Finally, just to add the confusion, technical analysis shows where the supports and resistance are but there is no guarantee that these would be tested at all. This is where hedging comes in. Something to think about over the weekend, perhaps?

Related post:
Marco Polo Marine: Looking into the future.

Marco Polo Marine: Looking into the future.

Tuesday, January 29, 2013

I think readers have heard enough from me on how I am positive on Marco Polo Marine ever since I started blogging about it after discovering persistent insider buying last year.

See:
Marco Polo Marine: Persistent insider buying.

Let us hear from some other people:

On the financial performance for Q1 FY2013, Mr Sean Lee Yun Feng, CEO:

“We are heartened by the set of results attained for Q1FY2013 amidst subdued market environment. The performance was consistent with our corporate strategies premised on four growth platforms which will continue to underpin our performance moving forward.

“On the shipyard front, our focus in securing projects with increasing sophistication is expected to continue to distinguish ourselves from competition.


“With regard to ship chartering, our deliberate shift in focus towards offshore oil and gas sector is expected to enhance contribution to both our chartering profits and margins. To this end, we have added a new OSV built by our Batam shipyard to our offshore fleet since mid-October 2012 and have had it chartered on a time charter basis.

“The recent successful listing of BBR on Indonesia Stock Exchange augments the Group’s focus to further penetrate into the Indonesian oil and gas sector. Apart from enabling BBR to reach out to a wider base of customers, the listing also makes avail more funding avenues to enhance the growth of BBR. With BBR now being our subsidiary, we will further align the offshore operations more closely as a group for better synergies.

“Last but not the least, our focus to generate profits through strategic alliances is beginning to bear fruits as well. Notably, our recently forged jointly controlled entity which engages in the bunkering logistics business has contributed to the bulk of the 57.1% increase in the share of results from jointly controlled entities”.

See: Media release.

OCBC Invesment Research, 28 Jan 13, on the results:

Marco Polo Marine (MPM) reported a 38% YoY drop in revenue to S$15.2m but saw a 3% rise in net profit to S$4.5m in 1QFY13, such that the latter formed about 20% of our full year net profit estimate, within our expectations. The fall in revenue was mainly due to slower progress in newbuild orders, resulting in lower shipbuilding revenue. This was offset by higher ship repair turnover, which grew 75.5% to S$8.6m in 1QFY13.

Ship chartering revenue fell by 5.2% to $5.5m with the mandatory docking of an offshore vessel. Overall gross profit margin, however, increased from 25% in 1QFY12 to 39% in 1QFY13 with a higher proportion of ship repair revenue (generally commands higher margins compared to ship building). Fair value estimate of S$0.56 under review.


OSK Research, 28 Jan 13, on the results:

Topline fell 38% but profits up 3%. Gross margin jumps from 25.2% to 38.6%. Most of the $9.4m fall in revenue to $15.2m was due to shipbuilding revenues falling 92% to $1.1m, while ship repairs grew 75.5% to $8.6m. The fall in shipbuilding revenue is mostly due to accounting procedures – last year, MPM could recognise 49% of shipbuilding revenues for BBR, but that vessel has been delivered and going forward due to consolidation it no longer can. Nevertheless, with a much greater share of revenue coming from high-margin businesses like ship repair and OSV-chartering, the gross margin jumped from 25.2% to 38.6%, flowing through to the bottom line for a 3% increase in net profit to $4.5m, in line with expectations as 1Q and 4Q are seasonally the weakest quarters.

Financially stable. Net gearing is low at 28.5%, and although net working capital looks negative at -$16.5m, most of it is due to the cheap short-term debt which at $35.7m forms 56% of current liabilities. MPM has no problems refinancing this due to its low gearing and the interest coverage this quarter of 13.5x.

15-20% charter rate premium in Indonesia. Our industry sources inform us that charter rates for OSVs and tugs & barges in Indonesia enjoy a large premium compared to regional rates, due to the massive shortage created by the cabotage law. With only four modern AHTS vessels of >8000bhp in the whole of Indonesia, and MPM effectively owning two, this is MPM’s most promising source of high-margin growth.

Maintain Buy with TP $0.61, MPM valuations look ready for catch-up. We continue to value MPM at 9x FY13F EPS for a TP of $0.61. For the last year, MPM has been trading below book value while it delivered a 23% jump in profits over the year. We expect MPM’s valuation to break out and catch up to the other oil & gas plays. The recent +51% performance of XMH – which similarly draws most of its revenues from Indonesia – gives us confidence that the market is beginning to revalue companies with strong earnings that ride on the growth of Indonesia.

My take?

When Marco Polo Marine's OSV chartering business in Indonesia takes off in a big way, the higher margins enjoyed now will translate into really impressive earnings. Patience will be rewarded.

Although I bought more recently at 40c and 40.5c, if Mr. Market should send share price lower again, I hope I would be brave enough to buy more.

Related post:
Marco Polo Marine: Still cheap.

Marco Polo Marine: Still cheap.

Saturday, January 19, 2013

I have not sold my shares in Marco Polo Marine as its price rose in recent weeks. In fact, I am looking to add to my long position if its share price should do a retracement to support.


OSK Research on 18 Jan 13:
Marco Polo Marine is enjoying 20% premia on its vessel charter rates in Indonesia, yielding a 50 - 60% gross margin on its Offshore Support Vessels (OSVs), due to the severe supply shortage in the country caused by the cabotage law. Target price: 61.0c.

Marco Polo Marine could be continually re-rated upwards over time.

For anyone patient enough, investing in Marco Polo Marine could be very rewarding. It is still under-appreciated and I hope it stays this way for a while more.


Drawing a Fibo fan, it is easy to see that the 20d MA is the immediate support and it also coincides with the 50% line. Share price could move higher from here, hit the 38.2% line before retracing to test the 61.8% line for support or it could move up from here in a fresh attempt to form a higher high. The resistance to watch is at 43c.

Related post:
Marco Polo Marine: Will buy more on pull back.

Marco Polo Marine: Will buy more on pull back.

Sunday, January 13, 2013

Marco Polo Marine is a turnaround story which is simply at the right place and at the right time. Of course, they have also positioned themselves to ride the next wave up. In the shorter term, however, we could see some weakness in its share price.

A retracement could see share price declining to the top of the recent base formation at 37c, give or take 0.5c, where we should see very strong buying interest. The formation of a white candlestick with a very long upper wick on the back of heavily increased volume in the last week suggests that a pull back is a strong possibility.

Weekly chart.

I would definitely buy more if support at 37c should be tested as the reaction to Marco Polo Marine's much improved numbers including the listing of its subsidiary in Jakarta seemed relatively muted. Marco Polo Marine's valuation is inexpensive compared to peers even at the high of 43c a share last week.

When Marco Polo Marine's numbers continue to improve and good news continue to be announced, more market participants will become believers and buy the stock. That is when we would see a truly breathtaking winning streak.

Related post:
Marco Polo Marine: Longer term buy on weakness.

Marco Polo: Longer term buy on weakness.

Sunday, January 6, 2013

The lower highs on the CMF suggest a weakening of smart money flow into the stock. The MACD, however, shows a strong positive momentum with a higher high in the process of forming.


Candlestick analysis gives cause for caution as two dojis and a black candle were formed in the last three sessions. However, the much higher volume as price pushed higher compared to the much reduced volume in the black candle day suggests a lack of sellers' conviction.


CMF shows higher lows on the weekly chart. This suggests that there is less money moving out of the stock in the longer term. MACD has turned positive and MACD histogram has formed a higher high, In the event of a retracement, support is at 38c while a stronger support is at 36.5c.

To me, it is quite clear that Marco Polo remains a longer term buy on weakness.

Related post:
Marco Polo: A neglected gem.

For those who prefer e-books:
Technical Analysis For Dummies

Marco Polo Marine: A neglected gem.

Tuesday, January 1, 2013

I have revealed how I diverted some resources away from S-REITs to invest in certain stocks which I feel are undervalued and have the potential for some meaningful capital gains in subsequent months.

DBS Vickers thinks that mid cap offshore plays could catch up with the large caps as risk appetite improves and the industry fundamentals remain strong. I share those sentiments.

Their top picks are Ezion, ASL Marine Holdings and Ezra Holdings.


My pick? Marco Polo Marine.

Persistent insider buying in Marco Polo Marine caught my eyes six months ago. When insiders increase their shares in large quantities, we must suspect that something good is brewing.

UOB is of the opinion that a new upcycle has begun for the OSV sector. This is supported by OCBC which revealed that the OSV to rig ratio will start falling in 2013 and this will favour vessel owners.

Marco Polo Marine together with its 49% owned Indonesian subsidiary ventured into the OSV sector in 2010 and currently own seven OSVs. Net profit received a leg up from their Indonesian subsidiary and doubled QoQ recently.

The scheduled listing of its Indonesian subsidiary on Indonesia Stock Exchange this month is likely to add some 30% to the NAV of Marco Polo Marine, according to Maybank KimEng.

Now, what does all this mean for Marco Polo Marine's current share price? It is too cheap.

ASL Marine Holdings last traded at 67.5c a share and its PER is about 8.9x. For Marco Polo Marine to trade at a PER of about 8.0x, its share price has to be about 50.5c. This is, in fact, conservative because EPS in 2013 is likely to be higher which means a PER of 8.0x will translate into a higher share price. Marco Polo Marine last traded at 38.5c a share.

This is just the beginning. If we believe that a new upcycle has just begun, then, the sector will continue to be upgraded. Indeed, analysts at DBS Vickers have a 12 months price target of 90c for ASL Marine Holdings.

Where would we see Marco Polo Marine's share price then? I wonder.

Related posts:
1. Marco Polo Marine: Persistent insider buying.
2. Marco Polo Marine: Patience will be rewarded.

See: Marco Polo Marine's insider trades here.

Adam and Conrad actually provide the blueprints – and the details – on how to make investing work.

One of the key skills you learn in this book: How to evaluate a business and the potential of its stock – in great depth! Worksheets are provided.

Now: Find out how!


A Christmas collection of charts.

Tuesday, December 25, 2012

Hello Kitty Christmas Tree!
Minneapolis - St. Paul International Airport

It is now the evening of Christmas and I have spent Christmas Eve and the whole of Christmas Day at home. I slept a lot and drank a lot of herbal tea. I ate mostly porridge. You guessed it. I am ill.

Here are some charts and my gut feel. Not much rigour but in the spirit of Christmas, I hope readers would be a bit more forgiving.

Target: 28c.
Target: 42c.
Target: $1.10
Target: $3.90
Target: 62.5c
Target: 83c
Take note that these are weekly charts and I am not expecting to make any fast money.

Ho, ho, ho! Merry Christmas!

Marco Polo Marine: Patience will be rewarded.

Tuesday, November 27, 2012

I added to my long position in Marco Polo Marine as long term support was tested. Today, its share price touched a high of 35c before closing at 34.5c on the back of rather high volume. The positive divergence between the CMF and price action has played out. The MACD is rising in the negative territory and we could see price going higher and momentum going positive once more. A retest of 37c, the high of the double top, could happen.

Daily chart.

Weekly chart.

Fundamentally, Marco Polo Marine presented an impressive set of numbers:


All-time high net profit of S$21.3 million against consecutive 8 years of record high revenue at S$89.8 million and record high gross profit at S$29.2 million for FY2012.


Record gross profit and net profit attained with margins at enhanced levels of 32.5% and 23.8% for FY2012, representing increases of 4.4% points and 3.0% points over FY2011 respectively.

Operating cashflow position reversed from a net cashflow used in operations to a net cashflow generated from operations of S$34.5 million in FY2012.


EPS of about 6.3 Singapore cents for FY2012, representing an increase of 23.5% over FY2011, while NAV per share increased by 14.4% to 41.4 Singapore cents as at 30 September 2012.

Declaration of a special interim dividend of 0.8 Singapore cents per share for Q1 FY2013.

See: Media Release.

In earlier blog posts, I stated my reasons for believing that Marco Polo Marine's share price is too low and that we could see a much higher price over time.

If we expect Marco Polo Marine's shares to trade at similar valuation to its peers, a PE of 8x would value each share at 50.4c. This implies a 46% gain from the last closing price of 34.5c.

Patience will be rewarded.

Related post:
Marco Polo Marine: Accumulation mode.


Marco Polo Marine: Accumulation mode.

Wednesday, September 26, 2012

On 19 June, I blogged about Marco Polo Marine's persistent insider buying activity. I initiated a long position and I have been updating that blog post in the comments section. The latest update happened yesterday.

Today, I added to my long position as its share price retraced to 34c a share.


Technically, we see the Bollinger Bands narrowing on the weekly chart. Expecting a big move in share price in the coming weeks. With the MACD forming higher lows on the weekly chart, momentum is improving as sentiments towards the company turned positive. The OBV bears this out as it shows accumulation taking place over the longer term.

Immediate support is at 33.5c while immediate resistance is at 35.5c a share.

Some might wonder why I look at the weekly chart here instead of the daily chart. I do this because I am interested in holding on to my investment in Marco Polo Marine for a longer period of time and the weekly chart shows me the longer term probabilities.

I would buy more on further weakness in its share price, everything remaining constant.

Related post:
Marco Polo Marine: Persistent insider buying.

Marco Polo Marine: Persistent insider buying.

Tuesday, June 19, 2012


I find Marco Polo Marine, an offshore and marine company, a rather interesting proposition at current prices of 31.5c to 32.5c a share.

1. PER of about 8x
2. Net profit margin just under 20%
3. NAV per share at 37c
4. Interest cover ratio at 8.3x
5. Gearing at 30%

Marco Polo Marine has the intention of listing an Indonesian subsidiary on the Jakarta Stock Exchange. This could unlock value as Kim Eng estimates the listing could value the company's stake in the Indonesian subsidiary at more than 30% of the company's current market cap.

Perhaps, it is the persistent insider buying over the last 12 months that really nailed it for me here:

Announce Date [Date of Effective Change]Buyer/ Seller Name [Type*]S/ W/ U ** Bought/ (Sold) ('000)Price ($)
After: No. of Shares ('000) ***% Held ***
05/06/12
[05/06/12]
LEE WAN TANG [DIR]S1,095 0.325195,31157.02                
 
05/06/12
[05/06/12]
NAUTICAL INTERNATIONAL HOLDINGS LTD [SSH]S95 0.325191,39956.17
 
01/06/12
[01/06/12]
LEE WAN TANG [DIR]S110 0.335194,21657.00               
01/06/12
[01/06/12]
NAUTICAL INTERNATIONAL HOLDINGS LTD [SSH]S110 0.335191,30456.14
 
16/05/12
[16/05/12]
LEE WAN TANG [DIR]S114 0.340194,10656.96           
16/05/12
[16/05/12]
NAUTICAL INTERNATIONAL HOLDING LTD [SSH]S114 0.340191,19456.11
 
10/05/12
[10/05/12]
LEE WAN TANG [DIR]S100 0.340193,73356.85                
 
10/05/12
[10/05/12]
NAUTICAL INTERNATIONAL HOLDING LTD [SSH]S100 0.340191,08056.08
 
15/12/11
[14/12/11]
LEE WAN TANG [DIR]S159 0.335193,89256.90                
 
14/12/11
[13/12/11]
LEE WAN TANG [DIR]S100 0.335193,73356.85                
05/12/11
[02/12/11]
LEE WAN TANG [DIR]S100 0.341193,63356.83      
05/12/11
[02/12/11]
NAUTICAL INTERNATIONAL HOLDINGS LTD [SSH]S100 0.341190,98056.05
     
02/12/11
[02/12/11]
LEE WAN TANG [DIR]S70 0.345193,53356.80               
02/12/11
[02/12/11]
NAUTICAL INTERNATIONAL HOLDINGS LTD [SSH]S70 0.345190,88056.02
     
28/11/11
[28/11/11]
LEE WAN TANG [DIR]S11 0.330193,46356.77              
28/11/11
[28/11/11]
NAUTICAL INTERNATIONAL HOLDINGS LTD [SSH]S11 0.330190,81056.00
     
28/11/11
[25/11/11]
LEE WAN TANG [DIR]S500 0.330193,45256.77                
28/11/11
[25/11/11]
NAUTICAL INTERNATIONAL HOLDINGS LTD [SSH]S500 0.330190,79955.99
      
07/09/11
[06/09/11]
LAI QIN ZHI [DIR]S71 0.337192,95256.63
    
07/09/11
[06/09/11]
LAI QIN ZHI [DIR]S100 0.343192,88156.60
     
07/09/11
[06/09/11]
LEE WAN TANG [DIR]S71 0.337192,95256.62               
07/09/11
[06/09/11]
LEE WAN TANG [DIR]S100 0.343192,88156.60
     
07/09/11
[06/09/11]
NAUTICAL INTERNATIONAL HOLDINGS LTD [SSH]S100 0.343190,29955.85
     
05/09/11
[02/09/11]
LAI QIN ZHI [DIR]S117 0.350192,78156.58
     
05/09/11
[02/09/11]
LEE WAN TANG [DIR]S117 0.350192,78156.58               
31/08/11
[29/08/11]
LEE WAN TANG [DIR]S100 0.350192,66456.54        
31/08/11
[29/08/11]
NAUTICAL INTERNATIONAL HOLDINGS LTD [SSH]S100 -190,19955.82        

 
29/08/11
[26/08/11]
LEE WAN TANG [DIR]S64 0.345192,56456.51               
25/08/11
[25/08/11]
LEE WAN TANG [DIR]S299 0.338192,50056.49        
25/08/11
[25/08/11]
NAUTICAL INTERNATIONAL HOLDINGS LTD [SSH]S299 -190,09955.79        

 
24/08/11
[23/08/11]
LEE WAN TANG [DIR]S50 0.340192,20156.41        
23/08/11
[22/08/11]
LEE WAN TANG [DIR]S251 0.332192,15156.39        
22/08/11
[19/08/11]
LEE WAN TANG [DIR]S170 0.333191,90056.32        
19/08/11
[18/08/11]
LEE WAN TANG [DIR]S300 0.347191,73056.27        
21/06/11
[20/06/11]
LEE WAN TANG [DIR]S100 0.374191,43056.18       
20/06/11
[17/06/11]
LEE WAN TANG [DIR]S150 0.373191,33056.15    
16/06/11
[15/06/11]
LEE WAN TANG [DIR]S120 0.376191,18056.10       
14/06/11
[13/06/11]
LEE WAN TANG [DIR]S150 0.377191,06056.07        
10/06/11
[09/06/11]
LEE WAN TANG [DIR]S100 0.386190,91056.02        
07/06/11
[06/06/11]
LEE WAN TANG [DIR]S200 0.385190,81056.00

Marco Polo: Down channel.

Friday, November 19, 2010

On 25 October, I mentioned that a relative of mine bought into this counter because of a BUY call issued by Kim Eng. Well, the uptrend which is approximately defined by the rising 50dMA was broken a couple of days later. The counter tried to recapture the 50dMA but failed to do it successfully. It has been trading under the 100dMA which is at 43c in the last couple of sessions.


A down channel is quite obvious and the channel support could see the counter test 41c next. MACD is in negative territory and just completed a negative crossover with the signal line. Any upward movement in price could just be a rebound within the down channel, therefore.

The thin trading volume is probably a consolation to bulls but without any buy ups accompanied by meaningful volume, price could drift lower.

Related post:
Marco Polo: BUY call by Kim Eng.

Marco Polo: BUY call by KIM ENG.

Monday, October 25, 2010

This could have happened in early October. A relative of mine bought some Marco Polo at 48c after reading a BUY call by Kim Eng with a target price of 60+c.  I cannot remember the exact target price now.  On hindsight, that was a high and price has been retreating since.


Although price closed at 43.5c today, the uptrend is still intact.  Connecting the lows of 2 June and 31 August makes this quite apparent. The MACD dipped into negative territory last week and together with the momentum oscillators, it paints a negative picture. The OBV shows massive distribution took place on 5 October and it has not shown any signs of sustained accumulation since.

What do we do if we want to go long here? We either wait for signs of a positive divergence or for price to test longer term MAs before entering.  The 100dMA is currently at 42.5c.


If we look at the weekly chart, we see that the rising 20wMA looks like it could form a golden cross with the 50wMA in another few weeks. The rising 100wMA is at 39.5c.  This MA has proven to be a strong support earlier this year in May/June. It is more reliable as a support than the 100dMA, therefore.  Based on the weekly chart, the longer term picture looks fairly good.

These observations are based purely on TA which is about probabilities. You have been cautioned. ;)


Monthly Popular Blog Posts

All time ASSI most popular!


Bloggy Award