The email address in "Contact AK: Ads and more" above will vanish from November 2018.

PRIVACY POLICY

FAKE ASSI AK71 IN HWZ.

Featured blog.

1M50 CPF millionaire in 2021!

Ever since the CPFB introduced a colorful pie chart of our CPF savings a few years ago, I would look forward to mine every year like a teena...

Past blog posts now load week by week. The old style created a problem for some as the system would load 50 blog posts each time. Hope the new style is better. Search archives in box below.

Archives

"E-book" by AK

Second "e-book".

Another free "e-book".

4th free "e-book".

Pageviews since Dec'09

Financially free and Facebook free!

Recent Comments

ASSI's Guest bloggers

NOL: Out of the doldrums?

Friday, April 8, 2011

NOL formed a higher low on 28 March although it has yet to form a higher high. The impetus for this blog post is NOL's closing above the 20dMA for the first time since 10 March. Together with some other observations, it seems that NOL could be coming out of the doldrums.

Some might remark that NOL promptly sank on 11 March and what makes it different this time? Could not the price sink next Monday? Indeed, it could. This is especially so when we realise that price closed exactly at resistance provided by the 38.2% Fibo fan line.

However, I feel that things are looking up because, on the daily chart:


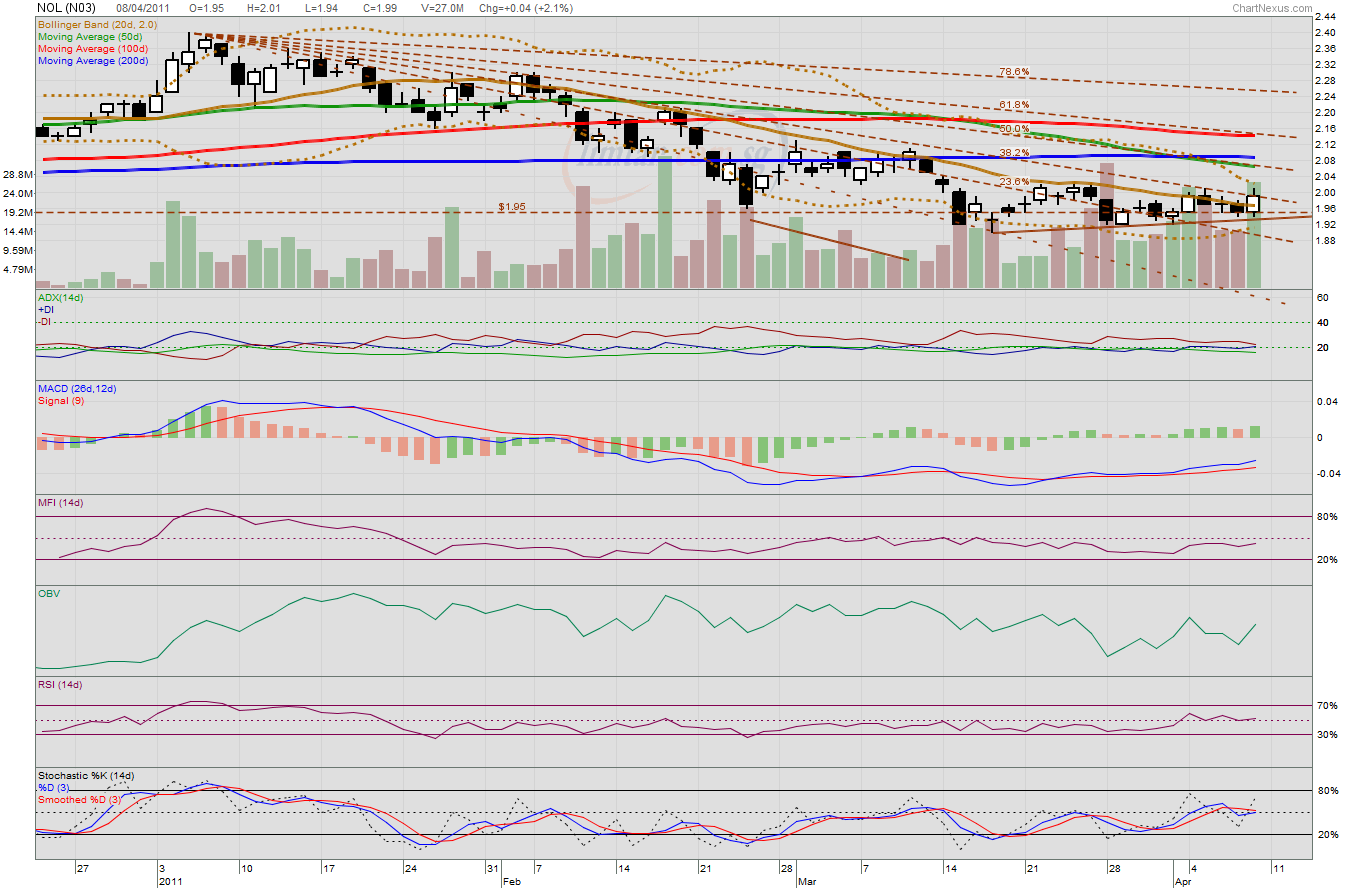
1. The MACD is higher now than it was on 10 March although it is still rising in negative territory.

2. There has been a prolonged period of low volatility which has resulted in tightening Bollinger bands.

3. As price moved higher lately, volume has not reduced dramatically like it did leading to 10 March.

On the weekly chart:


4. A white candle has formed on higher volume as a detachment from the lower Bollinger band takes place.

5. OBV shows a return of accumulation.

6. Stochastics suggests that the counter is oversold as it found itself trapped in sideways trading.

If there should be a pull back to $1.96 in the next session or two, I might initiate a long position. Near term upside targets are at $2.07 and $2.14 if the upward movement should continue.

CapitaMalls Asia: Strong uptrend emerging.

Despite strong buy calls from research houses, this counter's share price suffered from a prolonged period of weakness. However, recently, a strong uptrend seemed to be emerging for this counter. Refer to the orange color trendline support. Is this a reversal which would propel its share price much higher?

Volume in today's session was much lower than the previous day's but price still managed to close higher at $1.88 resistance, touching a high of $1.89 in the day. Rising on low volume is not a good sign usually but if we look at the bigger picture, the overall trend should be given more prominence. Indeed, the ADX seems to be turning up as the +DIs are rising. This is something we have not seen in a while. It suggests that a nascent uptrend could be gaining strength.


The MACD is rising higher in positive territory. The other momentum oscillators continue to rise as well. There is demand, there is accumulation and there is positive price momentum. The strength is impressive and I would be accumulating on weakness. I still have near term targets of $1.95 and $2.00 for this counter where price would meet with resistance. At what price would I accumulate? Immediate support is at $1.83.

Related post:
CapitaMalls Asia: Testing $1.88 resistance.


Monthly Popular Blog Posts

All time ASSI most popular!


Bloggy Award