The email address in "Contact AK: Ads and more" above will vanish from November 2018.

PRIVACY POLICY

FAKE ASSI AK71 IN HWZ.

Featured blog.

1M50 CPF millionaire in 2021!

Ever since the CPFB introduced a colorful pie chart of our CPF savings a few years ago, I would look forward to mine every year like a teena...

Past blog posts now load week by week. The old style created a problem for some as the system would load 50 blog posts each time. Hope the new style is better. Search archives in box below.

Archives

"E-book" by AK

Second "e-book".

Another free "e-book".

4th free "e-book".

Pageviews since Dec'09

Financially free and Facebook free!

Recent Comments

ASSI's Guest bloggers

Showing posts with label Wilmar. Show all posts

Wilmar: Bought at $3.28.

Tuesday, April 16, 2013

I bought shares of Wilmar's towards the end of the day at $3.28 a share as I observed what I thought to be weaker selling pressure on the part of Mr. Market. There seems to be a reluctance to sell at lower prices and we see hints of this in the chart.

We see the MACD higher as share price made a lower low.


This suggests that negative momentum has weakened. The CMF, a momentum oscillator that measures money flow, is also encouraging as it has moved into positive territory.

The candlestick formed today resembles a hammer and this is a bullish reversal signal. Of course, it needs confirmation in the next session.

In case of a continuing decline in share price, I see the next support level at $3.23.

Wilmar: Conflicting signals and what they could mean.

Wednesday, January 16, 2013

Wilmar's share price broke resistance at $3.64.

Volume has been declining as price pushed higher. Remember, volume is the fuel that drives rallies. Without rising volume, rallies could eventually sputter and die out. However, Chaikin Money Flow shows that smart money is still flowing into the counter.


The conflicting signals here suggest that Wilmar could do a correction using time and we might not see any hefty price correction. In case a price correction should take place, immediate support is at $3.64 and a stronger support is at $3.53.

The rising 20dMA will intersect the declining 200dMA at some point in the near future to form a golden cross. This suggests that the bulls have the upper hand and that any retracement in share price is likely to attract much buying interest.

It is always dangerous to try looking into the future with technical analysis but let me see if I am clairvoyant. With a healthy dose of patience and with a bit of luck, we could see $4.44 tested in the next two or three months. There. My powers are spent.

Related post:
Wilmar: Testing resistance with strong momentum.

Wilmar, China Minzhong and Sound Global.

Tuesday, January 8, 2013

Wilmar's share price could not overcome the resistance provided by the descending 200d MA. Look out for a retest of the support which approximates the 100d MA at $3.20. I would buy more if that should be tested.


China Minzhong's share price has established 86.5c as the resistance to watch. There is still a chance of a pull back to support provided by the rising 100d MA. I have sold some at resistance as a hedge and if support should be tested, I would probably buy more. Breaking resistance at 86.5c could see share price heading towards $1.00.


Two dojis in a row suggest indecision on the part of Mr. Market with Sound Global although a higher high on the MACD suggests a strong positive momentum and we could see price pushing higher. Expecting a band of resistance from 68c to 70c while expecting a band of support from 59c to 61.5c.


Related posts:
1. Wilmar: Testing resistance with strong momentum.
2. China Minzhong: What are we to do?
3. Sound Global: Another resistance level broken.

Wilmar: Testing resistance with strong momentum.

Saturday, January 5, 2013

Wilmar's momentum oscillators are firing away! They are strongly positive and the stock could go higher even though it has hit resistance provided by the 200d MA.

A correction in price would see strong support at $3.23 while immediate support is at $3.53.


Daily chart.
Weekly chart.

In the event that price action overcomes resistance, the immediate target is provided by the descending 50w MA and I would hazard a guess of $3.81. If that goes, then, it would be the 100w MA at $4.60 but I would be quite surprised if it should happen without at least a pull back in the next few weeks.

---------------------------
A simple, straightforward guide to the fundamentals of technical analysis.

Free shipping globally.


Go to:
Technical Analysis for Dummies

Wilmar: Buy or sell?

Wednesday, January 2, 2013

Today, one person asked me if she should still buy Wilmar's shares while another person asked me where is the first resistance level in case share price continues to rise. One person is thinking of putting in a long position while another person is thinking of possibly divesting.

Daily chart

It is obvious to any chartist that Wilmar's share price broke resistance.

On the daily chart, the descending 200dMA at $3.62 or so is where we would find the next resistance level. The 200dMA could push share price down in the near term. It has that ability. If that should happen, then, it presents a chance for anyone who missed the boat earlier to buy in.

Weekly chart

If the 200dMA could be overcome, then, looking at the weekly chart, we see the next significant resistance provided by the declining 50w MA. In very bullish circumstances, we could see the 100w MA tested in due course. The longer term technicals are supportive of this but it could take weeks for it to happen. If this should happen, it would be a nice price for divestment, wouldn't it?

Related post:
Wilmar: Smart money outflow is reversing.

A simple, straightforward guide to the fundamentals of technical analysis. 

Explaining the basic principles of analysis and showing how to implement them, Technical Analysis For Dummies dumps the confusing jargon and unreadable charts for basic explanations and practical guidance.

Buy pre-owned for only US$ 9.48. 2 copies left!
Free shipping. Now, this is a bargain!

See:
Technical Analysis for Dummies

A Christmas collection of charts.

Tuesday, December 25, 2012

Hello Kitty Christmas Tree!
Minneapolis - St. Paul International Airport

It is now the evening of Christmas and I have spent Christmas Eve and the whole of Christmas Day at home. I slept a lot and drank a lot of herbal tea. I ate mostly porridge. You guessed it. I am ill.

Here are some charts and my gut feel. Not much rigour but in the spirit of Christmas, I hope readers would be a bit more forgiving.

Target: 28c.
Target: 42c.
Target: $1.10
Target: $3.90
Target: 62.5c
Target: 83c
Take note that these are weekly charts and I am not expecting to make any fast money.

Ho, ho, ho! Merry Christmas!

Wilmar: Smart money outflow is reversing?

Saturday, December 8, 2012

Anyone investing in Wilmar for the longer term would be encouraged by the counter's weekly chart.

Even as share price continues its basing process which has been going on for months, Chaikin Money Flow (CMF) shows that the outflow of funds has ceased. With bearish pressure dissipated, any positive news could send share price up quite abruptly.


Bollinger bands are also constricting to a point where we could expect a violent movement in share price. So, which way? Up or down? Based on the CMF, dare I hazard a guess? I would guess "up".

This could simply be a rebound if it should happen, a rebound which could see price capped by the declining 50w MA which is currently at $4.00. Immediate resistance is at $3.20.

Related post:
Wilmar: A rebound or something more?

Wilmar: A rebound or something more?

Saturday, October 13, 2012

Wilmar is up 3.9% at $3.18 as players await further details from the Malaysian government on a CPO export-tax cut. "It's one of the better companies in terms of having feet in both Indonesia and Malaysia and (being) able to trade around any opportunities from that" on the potential tax change, an analyst says.

He adds, the slightly improved soybean supply-side numbers from the U.S. were also positive for the stock as soybean availability is key for Wilmar. He notes the stock is starting from an overly depressed position and a number of players are "relooking" it after its selloff.

Dow Jones & Co, Inc, Friday, 12 October 2012.

I don't like to sell as share prices form new lows. It just doesn't make sense to me. If I want to reduce exposure in downtrends, I would wait for rebounds as prices test resistance. After all, prices go down a river of hope.

I do not know if Wilmar's share price would continue to strengthen or how much it would rise if it should happen, of course. I just have to do what I plan to do if it happens.


I like to potter around a bit with charts and using the Fibo fan, the chart shows that price broke resistance in the last session but mostly retreated to close just slightly above resistance. A continuing rise in share price next week looks rather iffy. If it should happen, next target is $3.28

Of course, we can also say the the confluence of the 20d and 50d MAs at $3.20 is a formidable barrier. This could be the case but in a situation where price is no longer trending, MAs are weaker tools. I would turn to momentum oscillators in such instances for clues.

For anyone who thinks that Wilmar's share price is experiencing a blip in positive movement and that it is on its way lower, I won't be too sure. Look at the MACD which is a price momentum oscillator. It just formed another higher low. It shows that negative momentum is continuing to weaken.

The ADX shows that there is no trend per se and if there is any, it is a weak one.

What I can say for sure is that Wilmar's share price is going through a long drawn basing process. When is it ending? It will end when it ends.

Related post:
Wilmar: Is the tide turning as buying pressure returns?

Wilmar: Is the tide turning as buying pressure returns?

Friday, September 14, 2012

I bought more shares of Wilmar as its price went to a new low yesterday. Some might question why I did this. Was I not afraid of losing even more money? Well, it was a calculated risk based on certain technical signs.

As Wilmar's share price went lower, I noticed that the CMF was forming higher lows. So, share price was forming a positive divergence with the CMF. What is CMF?

CMF stands for Chaikin Money Flow. This is a money flow oscillator that measures buying and selling pressure. When the CMF is in positive territory, the bulls have the upper hand. When it is in negative territory, the bears are stronger.

So, if we look at Wilmar's chart, selling pressure was reducing even as its share price drifted lower.  We can see the selling pressure letting up with the CMF forming higher lows. It is a process.


When the CMF forms a bullish divergence while still in negative territory, it is saying that selling pressure is reducing. When the CMF crosses over to positive territory, it is saying that smart money has moved back in and selling pressure has given in to buying pressure. So, the smart money are buying as weaker long holders or late short sellers continue to sell at lower prices. Yes, price could continue to move lower even as buying pressure returned and it did.

Those who short sold as share price retested and broke the low of $3.04 just a few sessions ago probably contributed to the heavy buying today as they scurried to close their short positions.

If we double check with the MACD which is a pure price oscillator, we notice that it did not form new lows even as share price moved lower. If we check the MFI, a favourite of mine as it takes in price and volume and more effectively measures demand, we see it forming a higher low as price formed a lower low. Another positive divergence.

With central banks around the world easing monetary supply, expectations are for commodities and other cyclicals to do much better in future. Wilmar seems like a logical beneficiary.

I would pay attention to the declining 50dMA. At $3.32, it is just 8c away from today's closing price of $3.24. If it should be overcome on high volume, it would attract more buyers and force more shortists to close their positions. Then, we could see price going higher to test the support turned resistance at $3.52.

--------------------------

Wilmar said on Thursday it had repurchased 7.4 million shares from the open market, representing 0.115% of outstanding shares, at $3.00 each.

“The buyback is because Wilmar is good value at these prices. It also reflects the confidence that the Wilmar board has in the long term fundamentals and growth prospects of the group,” Wilmar’s spokeswoman said in an email.

REUTERS

Wilmar: Should we be buying?

Tuesday, August 28, 2012

A reader asked me if I am buying more shares of Wilmar as I said before that the time to buy is when the selling has dried up. Has the selling dried up?

Well, the trend is still obviously down and my investment is in the red. My long position in Wilmar is my biggest money losing investment on paper this year.

However, I have bought more shares of Wilmar as the MACD is rising while share price declined. Momentum is still negative but with a rising MACD, the negative momentum is weakening.


There is no obvious sign of accumulation or distribution with the OBV flat as the share price languished more or less at the 61.8% Fibo line.

Volume has been relatively low as the Bollinger bands begin to squeeze, confirming the picture of low volatility. A big move in Wilmar's share price could be on the horizon. Which direction? That is anybody's guess.

If the move is to the upside, overcoming the 20d MA on high volume would signal a breakout. If the move is to the downside, the low of $3.04 touched on 15 Aug is the support to watch.

A sign that things might have bottomed is when there is massive pessimism and no one is interested in buying anymore. In fact, there would be more who would sell even at a big loss because they believe the share price could move much lower over time. Then, there are the increasing number of "sell" calls by the research houses all offering much lower 12 months target prices.

The relatively low volumes, the gently rising MACD and the flat OBV tell me that there is currently a stalemate between the bulls and the bears, pending a possible big move in price with the constriction seen in the Bollinger bands. The trend is, however, still in the bears' favour.

Now, no one should tell you what you should do. You have to decide for yourself.

Related post:
Wilmar: Touched a new low.

Wilmar: Touched a new low.

Sunday, August 5, 2012

In the last session, Wilmar's share price touched a new low of $3.18. Many market participants are wondering if they should go long here. Of course, conventional wisdom would say wait for the sellers to be done selling.


So, are the sellers done selling? The OBV shows that distribution activity has not ceased. However, both MFI and MACD have not formed lower lows as compared to May 2012 when share price was higher but declining. Together, the technicals tell me that there are still sellers around but demand has picked up if only barely so.

Technically very weak, we could see lower prices for Wilmar's shares if the current floor fails to hold. Immediate support is at $3.18 while immediate resistance is at $3.54.

Although we could hope for a gap fill at $4.65 which is also where we find the declining 200dMA, that is a long shot and unlikely to happen in the near future.

After such a massive selling down, market participants are likely to take whatever gains they can and run for the hills if there should be any run up in share price. So, adopting a trading mentality could be fruitful for anyone interested in going long here.

Related post:
Wilmar: Not a time to sell.

Wilmar: Not a time to sell.

Wednesday, June 20, 2012


On 5 June 12, I did a blog post on whether it was time to go long on Wilmar. Yesterday, someone asked me as well if it is now a good time to go long on Wilmar.

To any seasoned market watcher, Wilmar's share price must look quite tantalising as it hit a low of $3.41 on 14 June 12. That was a good 43% lower than its one year high of $5.99 a share.

Now, if we should think of a reason for the decline in price, it is clearly because of the company's disappointing earnings. The company's crushing business is likely to remain very difficult for some time to come. In fact, the CEO said it could take a few years for excess capacity in China to be absorbed. As this business is about 25% of the company's revenue, a decline in its share price is to be expected but the decline has been disproportional. I have no doubt that short sellers made quite a bit of money here as well.


Wilmar's share price has seemingly found a floor and has rebounded somewhat. I see immediate resistance at $3.70 or so. If it should break resistance, we would probably see short sellers covering their positions which would send share price higher to test the next resistance.

If the company's share price should test a new low, everything remaining constant, we should see stronger buying interest returning. Technically, the momentum oscillators are rising and, so, support this thesis. Look out for a higher low in the momentum oscillators then. That would be a clear signal to go long as the share price is set up for a reversal.

Is it time to buy Wilmar's shares? I feel, at least, it is not a time to sell.

Related post:
Wilmar and China Minzhong: Time to go long?

Olam: Accumulate now?

Sunday, June 17, 2012


A few days ago, I blogged about Olam and how Kim Eng has a SELL recommendation. That got a reader who is invested in Olam sufficiently flustered to send me an email. Hey, I was just sharing an analysis which I thought made sense. Don't shoot the messenger and if it is any consolation, my badly timed initial investment in Wilmar fared worse.

"Olam has been the second worst performing member of the STI this year, with only Wilmar having done worse." (The EDGE, 18 June)

Anyhow, the article by Joan Ng in the same publication went on to report that CIMB Research thinks that present cheap valuations could be a buying opportunity for long term investors.

"The correct investment stratey to follow since 2009 has been to raise market exposure and beta when sentiment enters the panic zone, like now," Ajay Kapur, Deutsche Bank. He notes that there have been three major reflation exercises over the past three years.

"At the start of each of these episodes, investors were incorrectly cynical, consumed by the panic of the moment. We think we are on the verge of another policy reflation in the coming weeks or months. Start buying during this bottoming process rather than over-analysing." (The EDGE, 18 June)

For the numerically inclined, Olam is said to be trading at a price to book value of only 1.2x now compared to its trough of 1.5x during the global financial crisis.

Accumulate? Olam's management seems to think their stock presents great value too.

Related post:
Olam: Share price up on buy backs.

Olam: Share price up on buy backs.

Wednesday, June 13, 2012


I have always thought Olam's gearing level quite scary. Then again, it is the same with Noble and Wilmar although not as highly geared as Olam. I was told that their business models are such that high gearing level is nothing to worry about. Indeed, Mr. Market seemed to think so as their share prices were sky high once upon a time.

Gearing is a double edged sword and if a business is able to magnify its returns through gearing, then, higher gearing would intensify the returns many times over. However, in down times, things could turn really ugly. Then again, in the current environment of very low interest rates, borrowers are shouldering much lighter burdens.

When Olam announced that they are buying back shares from the market, my immediate reaction was a positive one. Hey, the management are confident in their own business and are walking the talk. However, when we remember that it still has plenty of debt in its books, it doesn't seem to make much sense anymore.

Kim Eng has this to say:
Share price jumps on buyback mandate. Olam’s share price has jumped 11% since the company announced last Friday that it has commenced a share buyback programme. While such a move is usually a positive sign, the circumstances for Olam seem rather unusual. Fundamentals-wise, other than to deter the short sellers, we do not think it is necessarily an enhancive step for shareholders. Borrowing money to purchase shares. The case for a share buyback is stronger for companies with piles of idle cash coupled with strong operating cash flows. Olam, however, is considered highly leveraged with net gearing of 189% and adjusted net gearing of 42% as at FY6/12. Since listing in 2004, its operating cash flow has been positive only in 2006 and 2009 as funds were needed for expansionary working capital.

Kim Eng has a SELL recommendation on Olam with a TP of $1.43.

Wilmar and China Minzhong: Time to go long?

Tuesday, June 5, 2012

My ill fated investments in Wilmar and China Minzhong are 30% and 45% down, respectively. The decision to be vested in these two counters were based on macro ideas and technically, they looked like they were resting on supports.

As regular readers know, I do not have cut loss prices and would seek to add to long positions if the technicals are favourable. Favourable? Yes, I look for higher lows in the momentum oscillators as share prices move lower.

Today, I added to my long positions in Wilmar and China Minzhong as their charts show me rising momentum oscillators while their share prices are retreating. The trading volumes have dwindled as well which led me to think that a floor could possibly be forming, if not the bottom.


Wilmar's share price is currently sitting on a golden ratio and if this should break, we could see $3.30 or even $3.08 tested next. Although the momentum oscillators are rising, the OBV is in decline which suggests that distribution activity is ongoing. I won't be too ambitious in adding to long positions.


China Minzhong's chart is similar to Wilmar's and if the Fibo lines I have drawn are any good, we could see 51.5c tested next. We could be seeing more selling although the the trading volume suggests that the action might not be as intense as before.

In both cases, it is not a good time to sell. Indeed, it would make more sense to stay vigilant for opportunities to buy in.

My strategy is to nibble and increase my additional purchases at lower prices if the technicals suggest that it could be a good idea. Of course, there is no way we can be absolutely sure and we can only call a bottom after it has been formed.

Charts: China Minzhong, Wilmar, Yongnam, Sabana REIT, AIMS AMP Capital Industrial REIT.

Friday, May 18, 2012

I have a friend who told me that he wants to buy more of China Minzhong at 50c. Why 50c? He can't quite say. Anyway, at 50c, I would have lost almost half of my initial investment in the company...


What does the chart say? Momentum is definitely negative and the MACD is still in decline. What is encouraging is the reducing volume over the last three sessions although it remains elevated. Today, a white spinning top was formed. Could this be a reversal signal?

Well. the OBV is still in decline which suggests distribution is ongoing even as price weakened. The MFI though seems to be forming a higher low.

The MFI takes into consideration both volume and price and is often seen as a measurement of demand momentum. So, it is telling us that there is some demand coming back as the stock was savagely sold down. A rebound could be on the horizon and we could see gap closing at 68.5c in such an instance.

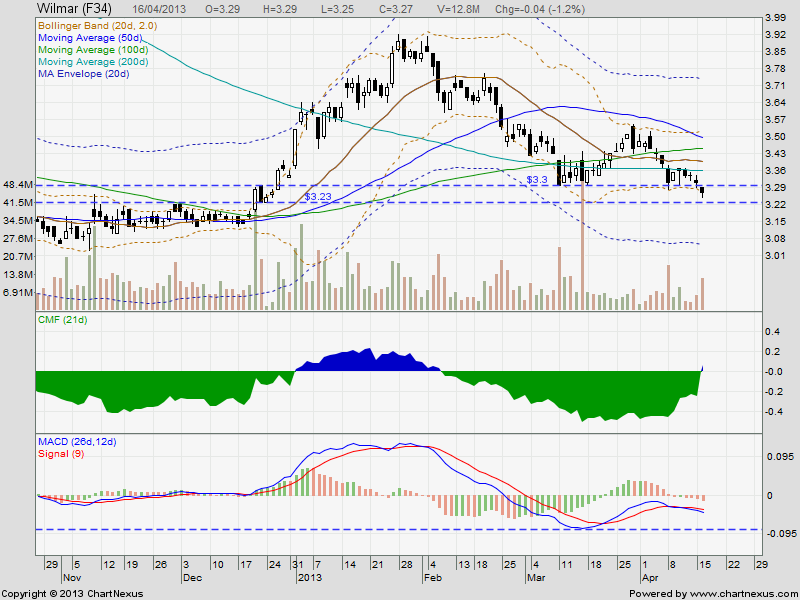
Wilmar's technicals have nothing encouraging for the bulls apart for the formation of a black hammer today.


This reversal signal would need confirmation in the next session but with the other technicals very bearish, it would be a nice surprise if a reversal does happen.

Yongnam has been sold down. It touched 22c today, a level not seen since August last year.


I have looked through Yongnam's numbers and they actually still look quite good. However, the lower highs on the MFI are obvious and buying momentum is absent. So, price could drift lower which could see it testing the low of 21.5c hit last August.

Although there has been some distribution going on as suggested by a mildly declining OBV, most shareholders are just holding on. Look at the volume. Look at where the OBV was last August and where is it now. Although price has reached the low levels of last August, OBV is at a much higher level.

To me, the price weakness of recent sessions is nothing alarming. It is not a result of rampant selling. It is just that without buyers share price could continue to drift lower.

I know quite a few people are looking to possibly adding more units of Sabana REIT to their portfolios.


MACD has crossed into negative territory. MFI, a measure of demand hit 50% and turned down. The OBV suggests that distribution is ongoing. The very high volume today formed a black hammer. The high volume suggests a heightened state of activity and the black hammer suggests that bears had the upperhand. Further weakness could see supports at 93c (100dMA) and possibly 90.5c (200dMA) tested.

AIMS AMP Capital Industrial REIT's chart is similar to Sabana REIT's but uglier.


The MACD has plunged headlong into negative territory while the MFI went into oversold territory. Very bearish. The OBV suggests that strong distribution activity is ongoing. Indeed, look at the trading volume spiking today. Immediate support is at $1.08 and if that goes, we could see $1.035 tested.

Wilmar: Settling dust?

Sunday, May 13, 2012

Bollinger bands are very popular in TA. Upper band acts as resistance and lower band acts as support. Look at Wilmar's daily chart, we see that price has pushed past the lower band. This gives us a very bearish picture. Support is weak. It also tells us that the counter is deeply oversold but remember that in very bearish conditions, oversold can stay oversold. It really doesn't say anything else.

Conventional TA tells us that we should buy when price breaks the lower band. This is to take advantage of oversold conditions. The belief is that, eventually, price would return to the lower band and then the middle band. The operative word here is "eventually". When exactly? Your guess is as good as mine, is it not?


Anyone who bought Wilmar's shares three sessions ago as it closed below the lower band at $4.70 would be licking serious wounds as the counter closed at $4.14 in the last session. Selling pressure has been enormous as share price went much lower.


The Lord Buddha said that nothing is permanent. Similarly, buying or selling pressure would come to an end one day. As our resources are limited, we want to buy when the selling pressure has dissipated.

Volume would be a good indicator if the sellers are done. In the last session, although Wilmar's share price closed lower, volume was less than half of the preceding session's which saw a huge gap down in price. A black spinning top was also formed and spinning tops, whatever the color, are usually signs of indecision on Mr. Market's part. Indecision in a downtrend? Doesn't that sound like good news for long holders? However, we should remember that one stick patterns are not very reliable. So, I would take this with a pinch of salt.


If price continues to decline with smaller magnitudes as volume reduces further, it would be a sign that selling pressure is dissipating and that the counter's share price could be looking for a floor, if not the bottom. This is when I would add to my long position. Bear in mind that it does not mean that price has bottomed as we can only call a bottom once it has been formed. Yes, only hindsight can call a bottom and hindsight, apart from being academically attractive, isn't terribly useful.

Dust is very much still in the air here and although it might not be in the same league as Long Men Ke Zhan's sandstorms, visibility is still not good enough for me. I am staying indoors for now.


Related post:
Wilmar: Mr. Market reacts to weaker earnings.

Wilmar: Mr. Market reacts to weaker earnings.

Thursday, May 10, 2012


Wilmar's net profit for 1Q 2012 tumbled 34%, year on year. Mr. Market is showing his displeasure in the usual way.

Let us draw some Fibo lines. I am using the high of 15 February at $6.05 and the low of 9 April at $4.76. I am doing this in my office and cannot post the chart here. So, you would have to do it yourself if you want to see the chart.

It is interesting how price gapped down massively at the start of the trading session just now and hit the 138.2% Fibo line and bounced up. At this moment, we have a black hammer that fills the area between the 123.6% Fibo line ($4.46) and the 138.2% Fibo line ($4.26). Could we see price going to $4.11 which is where the 150% Fibo line approximates?

The very high volume up till now is ominous and if this continues throughout the day without price breaking resistance provided by the 123.6% Fibo line, it could herald further weakness to come. Momentum remains negative and the bearish crossover of the MACD with the signal line suggests that things could get worse. The OBV is in decline and it looks like distribution is ongoing.

Fundamentally, Wilmar's management has suggested that 1H 2012 is likely to be challenging. However, the longer term prospects for the company should remain positive as a growing middle class in emerging economies demand better nutrition. In fact, revenue improved 10% year on year which suggests that demand is robust. So, I will want to add to my long position when the dust settles.

Why not buy now? With price action wedged between 123.6% and 138.2% Fibo lines, anyone buying now would want to buy closer to the 138.2% line which is currently acting as support. Would it hold up or would we see the next golden ratio at 150% tested for support?

In any technical analysis book, we would find that a hammer either black or white is considered a bullish reversal signal. However, one stick patterns are not terribly reliable. Also, the trading session has only begun. How would things look at the end of the day?

I still like Wilmar's businesses and its large regional footprint. Its weakening share price presents a chance to accumulate which would allow me to benefit from the company's possibly stronger performance in future. I will keep an eye on things in the meantime.

See: 1Q 2012 Results Briefing.

Should have sold in May and gone away?

Monday, May 7, 2012

In The Straits Times and The Business Times today, there are at least three articles which mentioned "sell in May and go away" and whether it holds any water. Has anyone sold a large part or all of their investments in the last few trading sessions?


Well, today, global stock markets retreated as the Greeks and the French elected new leaders into government. They are sick of austerity measures and they spoke with their votes! European debt story is still very much the key sentiment driver for global stock markets, it would seem.

Asian markets and the euro slumped on Monday after voters in France and Greece voted out their ruling parties in a backlash against austerity measures aimed at battling the eurozone crisis. Read article here: CNA.

I am not an economist. I am not a political scientist. Some issues are definitely beyond me. So, what do I do?

Someone just told me that timing is everything and that now seems like the right time. Right time? For what? I replied that things are increasingly more volatile and I find it harder to time anything.

I am chanting the same mantra to myself and that is to stay invested for income while keeping a war chest ready. This is the only strategy I know which would work either way.

I know that the majority of my portfolio which is in S-REITs is actually doing better now than a few months ago. My more recent investments are not doing as well, notably China Minzhong, SoundGlobal and Wilmar. These investments were made as the counters' share prices retreated from recent highs. Do I press the panic button? I like their businesses and I believe they would probably be around for a long time to come. I like the investment themes of agriculture and water. So, I am staying vested. I would probably add to my long positions too if TA shows me clearer signals to do so.

Don't panic. Stay clear headed. Revisit reasons for being invested in the first place. Are the reasons still valid? Are the investments still fundamentally good? If you want to buy more, what does TA tell you? Think with our heads and not our hearts. Good luck.

Related posts:
1. Sleep well at night with a plan.
2. Why do I not panic?

Charts in brief: 13 Aug 10 (Part 2).

Saturday, August 14, 2010

Golden Agriculture: CPO price rose again and Golden Agriculture's share price broke resistance provided by the 20dMA at 58c. MFI registered another higher low.  OBV shows a pick up in accumulation.  RSI bounced off 50% as support.  All signs point towards optimism of market participants. Price could possibly retest 60c resistance in the next session.


Wilmar:  The market does not like the news. Wilmar's downtrend which started on 12 Jan 10 is intact.  However, connecting the lows of 21 May and 29 Jun gives us an uptrend support which approximates the rising 50dMA. So, time to buy Wilmar? The MFI has formed a lower high and the uptrend support has been broken.  Demand has clearly plunged. $6.05 is the immediate support to watch. For any brave soul who is thinking of a punt, buying close to $6.05 if the support holds is probably the strategy to adopt.


Monthly Popular Blog Posts

All time ASSI most popular!


Bloggy Award