The email address in "Contact AK: Ads and more" above will vanish from November 2018.

PRIVACY POLICY

FAKE ASSI AK71 IN HWZ.

Featured blog.

1M50 CPF millionaire in 2021!

Ever since the CPFB introduced a colorful pie chart of our CPF savings a few years ago, I would look forward to mine every year like a teena...

Past blog posts now load week by week. The old style created a problem for some as the system would load 50 blog posts each time. Hope the new style is better. Search archives in box below.

Archives

"E-book" by AK

Second "e-book".

Another free "e-book".

4th free "e-book".

Pageviews since Dec'09

Financially free and Facebook free!

Recent Comments

ASSI's Guest bloggers

CapitaMalls Asia: Black hammer day.

Friday, January 28, 2011

Feeling somewhat under the weather, I think the very cold and dry weather here is getting to me. No drinking session for me. I came back to the hotel, took a warm shower, drank herbal tea I bought from a convenience store and I am feeling so sleepy now. Looking forward to going back to tropical Singapore early tomorrow.

In a quick post last evening, I mentioned that CapitaMalls Asia's share price "closed below the trendline support today at $1.89. I would not advise buying more at this price since the uptrend is compromised. I have turned cautious."

If I were not informed by TA, I could have bought more as price plunged today. Look at the high volume. I believe that the price weakness has brought out some shortists.


I received emails and comments regarding this counter. It is interesting that the counter is generating so much interest. To me, it is clear that many market participants are keeping an eye on the counter and waiting for clearer signs to go long here. Fundamentally, it is a strong company and technical weakness would offer opportunities for investors.

So, what am I doing here? Like I said, I have turned cautious and I am not adding to my position. I am waiting to see if the low of $1.83 would hold up as support. If it does hold up as support, I could add to my position. If $1.83 breaks, I would wait to see where is the next low.

Is there a chance of a reversal in the next session? A black hammer formed today as price gapped down at $1.88, touched a low of $1.85 before closing at $1.87. The bears won the day but the candlestick suggests some fierce fighting back by the bulls. So, although the black candle was formed on the back of much higher volume, there is some support.

Even if we know that a company has good fundamentals, waiting for the technicals to give clearer signs before going long is the way to go.

Related post:
CapitaMalls Asia: Closed at $1.89.

CapitaMalls Asia: Closed at $1.89.

Thursday, January 27, 2011

Price closed below the trendline support today at $1.89. I would not advise buying more at this price since the uptrend is compromised. I have turned cautious. However, notice that the trading volume is, once again, very thin on a black candle day. It looks to me to be a continuation of a low volume pull back pattern.


Does low volume mean that price could not weaken further? Definitely not but if we look at the OBV, it is obvious that there isn't any distribution activity. In fact, if you ask me, the OBV has gone up slightly in the last 4 sessions which suggests mild accumulation. This is consistent with what I said in my last blog post that there are bargain hunters out there who are waiting to buy at lower prices.

So, what am I looking out for now? The previous low was at $1.87. This was formed earlier this month. Will price form a higher low at $1.89 and recapture the uptrend later on? Of course, we might have to draw a gentler trendline support too. Or will the price go down further to test $1.83? No one has the answer but with the very low volumes as price pulled back, I do not think there would be any drastic sell downs in the near future. I would wait for the situation to become clearer before making my next move.

Related post:
CapitaMalls Asia: Doji at $1.91.

SoundGlobal: The former E-pure.

I was vested in E-pure when it was 20c a share thereabouts. This was back in early 2009. 

I was convinced that China's drive to keep its economy humming in the wake of the Lehman Brothers crisis would benefit the water infrastructure businesses. 


I was also heavily vested in Hyflux Water Trust at that time from 30c for the same reason.  

Read related blog post here.

E-pure was a Chinese company and was likely to be favored over Hyflux in China while Hyflux Water Trust was a business trust with zero gearing treating water for Chinese industrial estates and had a yield of about 17% at a unit price of 30c. 


I divested E-pure completely by the time it neared 60c a share and watched dumbfounded as the share price went on to form new highs, almost doubling from my sell price of close to 60c. 

Hyflux Water Trust was, of course, privatised a few months ago. 

Read related blog post here.


I have been wondering if I should re-invest in E-pure which has been renamed SoundGlobal for some time now. 

It remained on my watchlist but I simply refused to buy any of its shares at prices higher than 60c. 

That's just the memory effect working and, in this case, it seems to have paid off. Related post here.


I just told myself that if the price did not come down to more reasonable levels, there are always other investments out there.


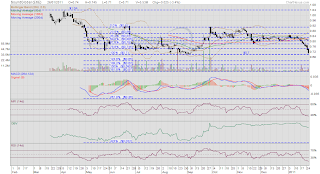
Since hitting a high of $1.04 on 7 April 2010, this counter has not formed a higher high. It is currently hugging the lower Bollinger band as it fast approaches the lows of early September 2010 at 70c a share. 

The obvious difference is that the low of early September 2010 was part of a bottoming process and the MACD was getting ready for a bullish crossover with the signal line. 


The MACD is now declining rapidly in negative territory as its distance with the signal line widens. This is very bearish.

Having said this, both the MFI and RSI are in oversold territories and 70c, being a low that was the price of a successful bottoming process could provide some support. 

Whether it would hold up is another question. I would not speculate on the strength of the support here.


When to accumulate? 

We want to look out for possible positive divergence between price and the momentum oscillators or volume. 

We want to look out for the downtrend halting and clearer signs that price is breaking out of downtrend. 

I like to use Fibo lines in such an instance to see how low price could go in case support breaks. Support is, of course, at 70c. 


Looking at the chart, the three golden ratios are at 62c, 59.5c and 57c. Buy some at those levels? 

I might if the other signs are encouraging.


Monthly Popular Blog Posts

All time ASSI most popular!


Bloggy Award