The email address in "Contact AK: Ads and more" above will vanish from November 2018.

PRIVACY POLICY

FAKE ASSI AK71 IN HWZ.

Featured blog.

1M50 CPF millionaire in 2021!

Ever since the CPFB introduced a colorful pie chart of our CPF savings a few years ago, I would look forward to mine every year like a teena...

Past blog posts now load week by week. The old style created a problem for some as the system would load 50 blog posts each time. Hope the new style is better. Search archives in box below.

Archives

"E-book" by AK

Second "e-book".

Another free "e-book".

4th free "e-book".

Pageviews since Dec'09

Financially free and Facebook free!

Recent Comments

ASSI's Guest bloggers

SPH: BUY calls aplenty.

Tuesday, July 13, 2010

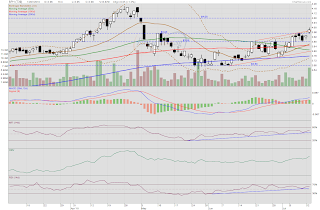
SPH: A slew of BUY calls from brokerages on the back of sterling results for 3Q10 sent the share price of SPH higher today. $3.95 resistance is now support. Up channel resistance has been broken. MFI and RSI continue their upward trends.  OBV shows continuing accumulation. Sell signal on the MACD histogram negated. Volume more than doubled as price touched a high of $4.00 today and closed 5c higher than the previous session at $3.98. Same question: $4.08? Looking more probable now. Punters who are considering a punt could possibly have an ideal entry point at $3.95 if this support is tested again.


Related post:
Charts in brief: 12 Jul 10.

Charts in brief: 12 Jul 10.

Monday, July 12, 2010

SPH: A sterling set of results with a 29.9% rise in 3Q net profit to $164.6 million from $126.7 million for the 3Q ending May. Could this push price to close higher tomorrow? Immediate resistance is at $3.95.  Closing higher than $3.97 would break the channel resistance and price could go much higher then.  With momentum still trending upwards, could we see $4.08? Perhaps.


Golden Agriculture: With the price of CPO firmly in a downtrend, the fundamentals are not looking up for Golden Agriculture. Momentum oscillators are downtrending and OBV is somewhat flat. Volume has, generally, been reducing since price recovered from the low formed on 24 May at 50.5c. We might be seeing the formation of a symmetrical triangle and there is a strong probability of price going lower. Immediate support is provided by the 200dMA at 52c.


LMIR: I think Mr. Market heard me.  Closing at 49.5c means that the downtrend resistance is broken. Momentum oscillators have similarly broken out of their downtrends. We could see the price testing the next resistance at 50.5c eventually if this keeps up.


Raffles Education: It might just turn out to be a short lived rally but a rather impressive one nonetheless. Price broke the downtrend resistance by touching a high of 34c before closing at 32.5c, forming an inverted cross which is bearish. Volume is also lower today as price attempted to move higher.  However, there is no negative divergence with the momentum oscillators yet. Could we see price trying to push higher again tomorrow? Perhaps. Immediate support is now the resistance turned support 50dMA at 32c. Could this hold up? It has to if price were to move higher.


NOL: A bearish engulfing candle. Frightful but the volume is much reduced on such an ominous black candle day. Therefore, is the counter just taking a breather? If the immediate support which is provided by the merged 20d and 100d MAs at $2 holds up, this could possibly be the case. If the support breaks, the next support is at $1.94.


Related posts:
LMIR: Recovering for real?
SPH: Up channel?
Raffles Education: A spectacular white candle.
Golden Agriculture: Rebounding.

FSL Trust: The skies are clearing up.

Sunday, July 11, 2010

Price stayed above the 20dMA in the last three sessions. The 20dMA, currently at 38.5c, is now resistance turned support. I decided to look at the 20dEMA as well.  The EMA gives greater weightage to recent prices and could sometime explain why price could not move past a certain point in the short term.  The 20dEMA is at 39.5c and seeing the price closed at 40c in the last two sessions is comforting.  However, the volumes were very low and the durability of the recent appreciation in price is questionable.  In fact, since a spike in volume on 18 Jun when the MACD made a bullish crossover with the signal line, volume has been reducing.


Let us look at some other technical indicators to gain more insights. The MACD is rising and pulling away upwards from the signal line in negative territory. The rising MACD is due to the upturning 20dMA, reversing its decline. Although this seems promising, the MFI has gone below its uptrend support due to the very thin volume in the last session as price stayed at 40c. Immediate demand seems to have reduced and some suspect that market participants are waiting for greater clarity.

Although the technicals are not totally inspiring, Mr. Market might spring a pleasant surprise on us and a further move upwards could see the gap filled at 43.5c which in the next session coincides with the declining 50dMA. Immediate support is a band from 39.5c to 38.5c. For anyone who wishes to buy into FSL Trust, technically, it would seem safer to do so now.

Related post:
FSL Trust: Above the 20dMA.


Monthly Popular Blog Posts

All time ASSI most popular!


Bloggy Award