The email address in "Contact AK: Ads and more" above will vanish from November 2018.

PRIVACY POLICY

FAKE ASSI AK71 IN HWZ.

Featured blog.

1M50 CPF millionaire in 2021!

Ever since the CPFB introduced a colorful pie chart of our CPF savings a few years ago, I would look forward to mine every year like a teena...

Past blog posts now load week by week. The old style created a problem for some as the system would load 50 blog posts each time. Hope the new style is better. Search archives in box below.

Archives

"E-book" by AK

Second "e-book".

Another free "e-book".

4th free "e-book".

Pageviews since Dec'09

Financially free and Facebook free!

Recent Comments

ASSI's Guest bloggers

NOL: That sinking feeling.

Monday, March 28, 2011

NOL is definitely not for the faint hearted. Today's black candlestick with price closing at $1.93 was formed on the back of very high volume and it looks like the downward momentum is strong as the MACD formed a lower high in negative territory. The MFI is also on its way to form a lower low.


Technically, NOL is still in a downtrend which started on 5 Jan 2011. A continuing downward movement in price could see the channel support at $1.84 tested or, in very bearish situation, the lower limits of the MA envelope tested. Any attempt to move higher would meet with resistance at $2.02, a recent thrice tested resistance level. Good luck to all vested.

Olam: Channel trading?

Olam could be seeing the early days of trading within a channel. Continuing weakness in price could see support at $2.68 tested.


ADX has been declining and the downtrend has weakened. The MFI and RSI could both test 50% for support soon. The MACD continues to rise, although in negative territory. Underlying momentum is strong and there is demand. To verify this, today's black candle day was on the back of relatively low volume.

See if a picture of low volume pullback should continue. Buying at supports could be very rewarding if this were the case.

CapitaMalls Asia: Dual listing failed to excite.

News of the proposed dual listing in Hong Kong didn't send its share price higher. In fact, it closed lower at $1.74 after closing the gap at $1.72.


The ADX continues to decline and the downtrend has definitely weakened. This does not automatically mean that the share price is going higher. We could be seeing the start of rangebound trading too. So, is it time to buy more? The volume for half a day's worth of trading is quite high and I would not be surprised if there should be more downside. Immediate support in the next session is at $1.70.

I will see how the share price moves in the next few days. If a higher low in share price should be formed and if the technicals are supportive of a move up, I could possibly increase my exposure to this counter. There could be some near term weakness in this counter's share price but over a longer term, the prospects could be more benign.

Related post:
CapitaMalls Asia: Proposed dual listing in Hong Kong.

CapitaMalls Asia: Proposed dual listing in Hong Kong.

CapitaMalls Asia's trading halt early this morning made me wonder if the rumours of dual listing in Hong Kong for this company are true. I just checked SGX's website and have confirmation.

"CapitaMalls Asia wishes to announce its intention to explore a secondary listing in Hong Kong to complement CapitaMalls Asia's growth strategy in China. China currently accounts for approximately 37%1 and 70%1 of CapitaMalls Asia’s total property portfolio by property value and Gross Floor Area respectively. Given the growing importance of CapitaMalls Asia's China business going forward, the Directors believe that the Listing will complement CapitaMalls Asia’s expansion in the country and achieve its longer-term strategic objectives." Read announcement here.

Like with all dual listing announcements, it is reasonable to expect a spike in buying interest in this counter. The fervour could dissipate after some time but I would expect some positive movement initially. Resistance levels could possibly weaken and higher highs could be formed.

See slides proposing secondary listing here.

Related post:
CapitaMalls Asia: Moving higher.

AIMS AMP Capital Industrial REIT: Lower gearing.

Sunday, March 27, 2011

AIMS AMP Capital Industrial REIT will see a lower gearing of 32% very soon. This is because their Japanese property has been successfully divested for a sum of JPY1.483 billion or about S$23m. Read announcement here.

Just two days ago, I suggested that at 20c/unit, this is a value proposition. Although, technically, the malaise is quite obvious, I went ahead and bought more at 20c and 19.5c as its price declined in the last two weeks. Fundamentally, as a cash flow generator for the next two years, it is almost bullet proof.

I am very much tempted to add to my position but my investment in this REIT has already surpassed Saizen REIT to become the largest investment in my portfolio by market value now. So, unless its price weakens further to a more compelling level, the prudent thing would be to refrain from adding exposure to it.

For others who are thinking of initiating a position in this REIT, well, evaluate the facts and see for yourself. See if you agree with me.

Related post:
AIMS AMP Capital Industrial REIT: Still bottoming?

Capitaland: To sell or to buy?

I read an article in The EDGE with interest as JP Morgan "upgraded the Singapore property sector from underweight to overweight largely because it believes the market is discounting physical market price declines of 12-40% which are too bearish." At the top of its buy list are Capitaland and CDL.

When I first commented on Capitaland on 10 Feb this year, I said that "A reader asked me if it was time for her to buy more Capitaland shares last evening. I told her I expect more downside today. In confirmation, the low of May 10 at $3.46 was taken out today without any hesitation by Mr. Market. The formation of three black crows now suggests that price could go lower. Some would say that it is more accurately described as two and a half black crows but I am sure the distinction is just academic.

"The next low to look at is $3.28 of July 09 and another reader today asked if it is time now to buy some especially if that low were tested. It would take someone very brave to buy in the current conditions, I feel. Could we see $3.28 taken out without hesitation by Mr. Market just like $3.46 was taken out today? Why not?" Read blog post here.


Price went on to touch a low of $3.08 on 17 March. However, anyone who bought some at the low of 17 March or thereabouts would be in the money now. The positive divergence on the MACD and share price is quite obvious: higher lows on the MACD and lower lows in share price. The ADX is also declining as the +DI crossed over the -DI on the upside: the downtrend is weakening.

For anyone still holding and for those who are thinking of entering, the question might be: "Would the price go higher?" I don't have the answer. I will say that the upward momentum seems to be weakening as long legged dojis were formed in the last two sessions. So, the downside risk is higher. The MACD, although rising, is still in negative territory and, so, we could just be seeing a rebound. Momentum is still negative.

If price should go higher, I see resistance at $3.40, a neckline. If that should break, I see a resistance band between $3.46 to $3.48. Beyond that? $3.56. If price should weaken? I see immediate support at $3.27, followed by $3.24.

I have only an academic interest in this counter (for now) but if I were to go long on this counter, I would do so on weakness as it retests supports. If I owned some shares bought at $3.08 thereabouts recently, I would sell some as it tests resistance at $3.40, if it should happen. If price goes higher, I would have more to sell. If price goes lower, I have the funds to buy more.

Cambridge Industrial Trust: Going for excess rights.


My entry into Cambridge Industrial Trust could not have been better timed. I became a unitholder again in the morning of 11 March at the price of 51c/unit. Of course, we know what happened in Japan on that day.

In my blog post that day, I said that "If the nil-paid rights should trade at 4c to 5c, it would be quite attractive ... Any price less than 4c would be a steal!" Well, the nil-paid rights are not trading below 4c and I didn't manage to "steal" any. Read blog post here.

I also missed the opportunity to accumulate at 47c/unit when the REIT was still trading CR. You might remember me saying this "What are my plans now? Buy more if its price weakens further? Looking at the daily chart, CIT is trading below the 200dMA. So, I look at the weekly chart for hints of the next support. The rising 100wMA is at 46.5c now and should provide relatively strong support. 46.5c? That is some way to fall from here! Yes, it is but remember that TA shows us where the supports are and not necessarily that they would be tested. If it should be tested while the counter is still CR, I would buy more.

"Buying 16 lots more at 46.5c would mean an average price of 46.11c... Of course, owning more units could possibly entitle me to more excess rights as well." Read blog post here. It never hit 46.5c where I was waiting and the lowest it went to was 47c. Tough luck.


So, since I got 17 lots at 51c, I would get 2,125 rights. I would, of course, round it up to 3,000 rights by applying for excess 875 rights. I will also apply for more excess rights in the hope of lowering my average price. With its unit price closing at 48.5c and hitting a high of 49c in the last session. This rights issue would be the first one I might not be making any money from in quite a while.

Would I stay invested? Well, the REIT's numbers have improved and should be a reliable passive income generator although I discovered something in small print and I replied to a reader on 19 March saying: "I looked at the announcement by CIT's manager again. We have to read the fine print. Tricky. 5.07c DPU would only kick in end of 2012 once the Extension Development Works are completed. Otherwise the DPU is 4.84c, post rights. So, to secure a 10% yield, buying at 48.5c per unit or lower would do it." See comments here. Yes, this was in fine print. Nothing wrong but it would have been better if the numbers were included in the table proper. I almost said something scathing when I read the announcement again.

So, although I am disappointed in more ways than one, I would probably stay vested unless I have a good reason to divest. Worst case scenario? A distribution yield of 9.7% for my investment.

First REIT: Accumulate on weakness.

Saturday, March 26, 2011

On 21 March, I mentioned that "Technically, the REIT is still in a downtrend which started on 20 Jan 2011. The trend resistance is at 74c. If price is able to break 74c convincingly, by this I mean with higher volume, we could see old highs tested as the downtrend breaks." In the last session, the REIT touched 74c although it closed at 73.5c which is still within the downtrend. Volume was relatively thin.


Checking the ADX, we see the -DI declining while the +DI has turned up. In fact, the +DI is close to crossing the -DI on the upside. The ADX keeps declining which suggests that the downtrend, although intact, is weakening. So, waiting to accumulate at the 200dMA could be wishful thinking in the near future.

In a change of plan, I would increase exposure to this REIT on any weakness and this would be at 73c (100dMA), 72c (lower Bollinger) and 71.5c (the recent low of 17 Mar).

Related post:
First REIT: Rising on low volume.

CapitaMalls Asia: Moving higher.

Friday, March 25, 2011

CapitaMalls Asia's price action is most pleasing today. Momentum oscillators are all rising strongly, suggesting strong demand and accumulation. Volume has been rising for 3 days in a row as price moved higher.

I have said earlier that the former support at $1.83 would become the resistance to watch if price were to move higher. This is still valid. In fact, the declining 50dMA is approximating $1.83 as well. However, I decided to draw some Fibo retracement lines as well as to use Fibo fan lines to see if they agree on this. I hardly use fan lines although I had experimented with them many moons ago.


It is interesting that the Fibo fan lines suggest $1.80 (61.8%) as a strong resistance while the Fibo retracement lines suggest that $1.81 (50%) is a strong resistance. So, in the event of a continuation of upward movement in price, if these resistance levels are strong enough, we might not even see $1.83.

So, what would I do? I would queue to divest partially at $1.80 as a hedge. If $1.83 were to be tested, I would divest again. Good luck to fellow shareholders.

Related post:
CapitaMalls Asia: Downtrend broken.

Cache Logistics Trust: Downtrend intact.

After a brief two sessions of trading above the downtrend which started on 28 Jan, its unit price is once again within the downtrend. Fundamentally strong, this REIT's technicals are somewhat weak. The OBV suggests that distribution is ongoing.  

Could the divestment on 21 March by substantial shareholder, Morgan Stanley, have spooked investors? Morgan Stanley's stake in the REIT reduced from 7.1860 % to 6.9790 %.


With the chart spotting positive divergences and with the MFI suggesting some underlying demand, I expect the supports to hold up if retested. Unless distribution activities cease, it would be hard for price to move higher, however. So? This REIT could be bottoming too and, based on its strong fundamentals, I would accumulate on weakness, if any.


Related post:
Cache Logistics Trust: Mixed signals.

AIMS AMP Capital Industrial REIT: Still bottoming?

It is quite clear that this counter was in a downtrend until two sessions ago when price broke out of a steeper downtrend which started on 17 Feb 2011. Breaking out of the downtrend on very low volume could mean that the counter is starting a period of rangebound trading as it finds a bottom.  If this were true, we could see price trapped between 20c and 21c for a period of time.


Although the MACD histograms formed a higher low, the MACD itself did not although we could see it forming a higher high if the bouyant price action should continue. The higher lows on the MFI are quite obvious and the OBV has flattened in recent sessions. The mad selling down has ceased and the REIT has found support for now.

Fundamentally, it is a value proposition at 20c/unit as it would mean a distribution yield of 10%. With its loans not maturing until almost 3 years later and at a very low interest rate of 2.16%, there is very little risk in parking our funds here if we are looking for high yield investments. It is reasonable to assume, therefore, that its yield should lend support to its current unit price.

Related post:
AIMS AMP Capital Industrial REIT: Positive divergence.

CapitaMalls Asia: Downtrend broken.

Thursday, March 24, 2011

Closing at $1.72 means that the short term downtrend is broken. Of course, if price were to go higher tomorrow, we would have confirmation. If price were to close below the trend resistance tomorrow, the break out would be a fake out.


With the -DI declining as the ADX falls, the downtrend is definitely weakening and the +DI is rising which is good news for people waiting for a possible trend reversal. The MACD has completed a bullish crossover with the signal line in negative territory and is pulling away. Momentum is encouraging. The MFI has formed a higher low suggesting that underlying demand is strong.

If price were to move higher, immediate resistance would be at $1.75. Eventually, if $1.75 were overcome, a test of resistance at $1.83 is probable in time.

Related post:
CapitaMalls Asia: Low volume retreat.

Saizen REIT: Update and sale of Johnan Building III.

Wednesday, March 23, 2011

We have more good news for Saizen REIT.  Firstly, Royal Hills Katagiri, which is located in Sendai, was viewed by the property manager today and was reported to be intact. This was the last of the 28 buildings which were reported as potentially affected by the earthquake and tsunami. "In the areas affected by the earthquake and tsunami, all 28 properties in Sendai, Morioka and Koriyama appear to have sustained only minor damage." Read announcement here.
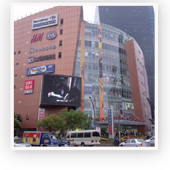
Johnan Building III
Separately, the manager of the REIT reported the sale of another building today and this is really good news because it shows that investors' interest in Japanese residential properties is still very strong. This is especially remarkable given the recent disasters which shook the country.

The property divested is Johnan Building III. This is located in Fukuoka and is from the property portfolio of YK Shintoku. It was built in June 1983 and comprises 24 residential units, 6 commercial units and 21 car parking lots.

The property was sold to an independent private investor for a cash consideration of JPY 312,577,516 (S$4.9 million).  This was at a 0.5% discount to the property's valuation of JPY 314 million. Read announcement here.

Good news all round for Saizen REIT and we should see the REIT's unit price recovering gradually although to recover to the pre-crisis high of 18c could be difficult. Psychologically, there would be a shadow of doubt in the minds of investors. Although I have little doubt that gap close at 15c would happen, I believe that it might not be easy going beyond and that 15.5c and 16c would be formidable resistance levels.

Fundamentally, there would be some repair costs to contend with. It is also reasonable to assume that there could be some downward pressure when it comes to rental income for contracts which are up for renewal if the Japanese economy suffers a setback from the triple disaster. The Japanese Yen could stay strong in the short term but the longer term picture is clouded as the massive injection of liquidity by the Bank of Japan could weaken the Yen in time.

After taking into consideration the gloomier technical and fundamental pictures, it is still truly a relief that my worst case scenario of a total loss of the 28 buildings did not come to pass. Of course, the development at the Fukushima power plant needs monitoring as a meltdown which seems less likely with the passing of each day could impact the 3 buildings in Koriyama which are less than 60km away.

It could be too early to pop the champagne but the worst does seem to be over.

Cache Logistics Trust: Mixed signals.

Tuesday, March 22, 2011

Cache Logistics Trust's price action formed a hangman today, not a bullish signal, surely. However, closing at 94c is bullish since it is beyond the trend resistance. So, is the downtrend broken? It would seem so.


The momentum oscillators are encouraging and are still trending upwards with higher lows. A continuation of the upward movement would see immediate resistance at 96c which would be a good price to divest perhaps partially for a quick trade. Price could even touch 97c if sentiments are very bullish.

Related post:
Cache Logistics Trust and CapitaMalls Asia.

AIMS AMP Capital Industrial REIT: Positive divergence.

I am seeing positive divergence in the daily chart. Do you see it? Look at the higher low in the MFI which has just risen out of oversold territory. The upmove could see an immediate target of 21c and it could even test 21.5c before a pull back happens. Good for a trade, perhaps.


Related post:
AIMS AMP Capital Industrial REIT: More upside?

CapitaMalls Asia: Low volume retreat.

Although the stock touched a low of $1.57 in the recent sell down, the immediate support is still at $1.60. This is something I established sometime back using Fibo lines. If retested, $1.60 is likely to be a strong support as it has been tested twice since the low of $1.57 and held up successfully on both occasions.


Since the formation of a white spinning top three sessions ago, price has been retreating but on declining volume. The counter is not experiencing a massive sell down but a lack of buyers.

The MACD is rising again and we could be seeing a basing process for the stock. With the MACD still in negative territory, it is still too early to tell if the stock is going to emerge from its downtrend but the worst could be over. Buy more at $1.60 if support holds up? I just might do that.

First REIT: Rising on low volume.

Monday, March 21, 2011

In my last blog post on the REIT, I suggested that the downside proposition looked more persuasive but I was also beginning to see positive divergences. Today, the MACD turned up and formed a higher low.


Price moved higher and closed at 73.5c. I think the positive divergence has been validated. However, rising on rather low volume is lacking in persuasive power.

Technically, the REIT is still in a downtrend which started on 20 Jan 2011. The trend resistance is at 74c. If price is able to break 74c convincingly, by this I mean with higher volume, we could see old highs tested as the downtrend breaks.

Unable to break the trend resistance at 74c could see the REIT trading lower and I would not be surprised then if the rising 200dMA should be tested for support. This is still at 70c.

Related post:
First REIT: Buying more?

Cache Logistics Trust and CapitaMalls Asia.

Cache Logistics Trust: On a day with lower volume, price could not break out of the downtrend. Instead, a doji, suggesting indecision, was formed.


Could we see price overcoming resistance and test the merged 50d and 100d MAs at 96c? Although the positive divergences are plain to see, we need volume to expand on any move upwards in order to overcome the trend resistance. Immediate support is at 92.5c in case of a pull back.

JP Morgan reduced its holdings on 15 March from 6.97 % To 5.83 % (44,210,000 units to 37,032,000 units).  That's a reduction of 7,178 lots. That was the day the trust touched 91c.


CapitaMalls Asia: No breakout today which obviously means that the downtrend is intact. Immediate support is at $1.66. If that were to break, keep an eye on $1.57. If it were to be retested intact on lower volume, it would be bullish.


A breakout would see immediate resistance at $1.75, $1.78 and, ultimately, $1.83.

Related posts:
Cache Logistics Trust: Positive divergences.
CapitaMalls Asia: At resistance.

Saizen REIT: Stabilising.

Congratulations to fellow unitholders who did not panic and sell at 13c. It does seem as if things are improving at the Fukushima plant and let us hope that things would continue to improve.


The management has yet to report on the final property in Sendai, Royal Hills Katagiri, which has not been visited. If the research by a reader, Data, which says that this property is located only 2km from the coast of Sendai is correct, it could cost a lot of money to repair the building, if at all possible. This property is 0.6% of the REIT's NAV and contributes to 0.4% of the REIT's annual income. So, the impact is not likely to be great even if it were to be written off.

Technically, there is still a chance that the counter could attempt a gap close at 15c and for people waiting to reduce exposure or to cut loss, 15c is still a preferred price compared to 13c or, indeed, 12.5c at the height of the panic selling last week.

Insider buying:
Beagle Capital Limited bought 20 lots of Saizen REIT warrants at 5c per warrant on 18 March.
Beagle Capital Limited bought 900 lots of Saizen REIT units at 13.72c per unit on 18 March.
Argyle Street Management Holdings Limited bought 150 lots of Saizen REIT units at 13.3c per unit on 18 March.

Related post:
Saizen REIT: Insider continues to buy as price recovers.

CapitaMalls Asia: At resistance.

Sunday, March 20, 2011

Volume expanded visibly as price moved higher in the last session, touching a high of $1.75 before closing at $1.72, forming a white spinning top in the process. I don't like a spinning top in the current picture as it suggests indecision. Also, closing at $1.72 means that the downtrend is still intact.


If the 20dMA should be overcome in the next session, the downtrend would have been broken and we could see price rising to test $1.83, a previously strong support which should be a strong resistance now. In the event that $1.83 were breached, price could touch a high of $1.87. My refusal to sell in the recent price weakness would then be rewarded.

However, a continuation of the downtrend would find support at $1.60.

Related post:
CapitaMalls Asia: Green in a sea of red.

First REIT: Buying more?

Saturday, March 19, 2011

I like First REIT and it is a large investment in my portfolio. Although, fundamentally, I think 72.5c/unit is a fairly attractive price, technically, it looks rather weak. This is why I have not added to my long position in the REIT in the current environment.


Technically, the REIT tested resistance at 72.5c in the last session on the back of low volume. If it did manage to break immediate resistance, it would meet with resistance at 73.5c and 74c. If volume stays tepid, chances of resistance at 72.5c being overcome are rather low. Of the 450 lots which changed hands in the last session, 321 lots were sold down at 72c.

The downside proposition looks stronger. The rising 200dMA should provide stronger support at 70c which is a psychologically important round number. I would probably add to my position closer to this level. Having said this, I might be seeing the beginnings of positive divergences on the daily chart and we could see price rebounding quite smartly if they are valid.


Referring to the weekly chart, it is quite obvious that the uptrend is intact and this, to me, means that any short term weakness is an opportunity to accumulate on the cheap.

Related post:
First REIT: Is the bear just resting?

Cache Logistics Trust: Positive divergences.

Friday, March 18, 2011

I initiated a long position recently in this Trust on 15 March at 91.5c. That decision was made mostly on fundamentals. The technical consideration was that 91.5c was the lowest it ever hit since its IPO but it went on to touch 91c on the same day. I was even musing as to whether it would hit 88c next which, incidentally, is its NAV/unit.

Today, I decided to rely on the many positive divergences in the daily chart of CLT and I added to my long position with additional purchases at 92.5c. The counter closed at 94c today, forming a long wickless white candle in the process. Volume was higher than the session before too.


However, closing at 94c means that the downtrend is still intact. If there should be a follow through next week, we would see the downtrend broken and price could rise to test resistance at 96c as provided by the merged 100d and 50d MAs or even 97c which is where we find the 200dMA.

Related post:
Cache Logistics Trust: Initiated long position at 91.5c

AIMS AMP Capital Industrial REIT: More upside?

I bought more of this REIT at 20c two days ago and I bought more again yesterday at 19.5c. My overnight buy queue at 19c was not filled today although some 6 transactions, totaling merely 68 lots, sold down the REIT at 19c today. At 19c /unit, the distribution yield would be 10.53%.

Do I think the price is going higher or lower?

Fundamentally, there is nothing wrong with the REIT. Financially, it is very much stronger than its MI-REIT days. It has also reported on the status of its Japanese property in Tokyo and the situation is benign. Read blog post here. With an expected DPU of 2c per annum, the REIT looks very attractive at 20c per unit, the price it closed at today. In fact, on closing, 4,543 lots were bought up at 20c per unit.


Technically, the downtrend is quite obvious. However, forming a dragonfly doji is bullish. So is the higher low on the MACD histograms. Looking at the OBV, I see something interesting and that is how the OBV formed a higher low in the recent sell down compared to the low formed in late February when price was somewhat higher. This means that there is ongoing accumulation as price weakened recently.

I see immediate resistance at 20.5c which is where we find the steepest trendline resistance. A fair upside target in the event of a follow through is 21.5c which is where we find the next trendline resistance and the declining 100dMA.

Related post:
AIMS AMP Capital Industrial REIT: Bought more at 19.5c.

Saizen REIT: Insider continues to buy as price recovers.

Argyle Street Management Holdings Limited, a substantial shareholder of Saizen REIT, bought another 600 lots at 13c/unit on 17 March. This increased their holdings from 15.201% to 15.252%. See announcement here.

Saizen REIT recovered today by 1c or 7.7% to close at 14c. There is news that Japan could restore power to cooling systems at the nuclear power plant as early as tonight. If it pans out well, we could see the unit price of Saizen REIT closing the gap at 15c next week.


On the weekly chart, a white candle was formed. Technically, this is encouraging under normal circumstances but the circumstances now are not normal. Let's see how things turn out in the next few days.

Related post:
Saizen REIT: Hold or sell as insider buying continues?

Hutchison Port Holdings Trust: A weak debut.

Many were expecting HPH to open underwater and that was exactly what it did. I have not tried my hands at IPOs in years, taking to heart what Warren Buffet said about how IPOs are never undervalued and never good for investors. Of course, we could make money from IPOs in very bullish circumstances but Warren Buffet was referring to value and not price.

HPH touched a low of 94c before closing the session at 95c today.


Saizen REIT: All but one property have been visited.

Thursday, March 17, 2011

"In the areas affected by the earthquake and tsunami, all 6 properties in Morioka and Koriyama, and 21 out of 22 properties in Sendai have been viewed by the property managers thus far, and preliminary reports have confirmed that these properties appear to have sustained only minor damage and to have remained intact.

"To-date, we have not received any reports of tenant casualties, and none of the properties viewed appear to have been vacated.

"The remaining property yet to be viewed by the property manager due to transportation contraints is Royal Hills Katagiri, belonging to the TK operator YK Shingen."

Royal Hills Katagiri

Read announcement here.

Please read this:
Help Japan and donate generously.

CapitaMalls Asia: Green in a sea of red.

The positive divergence observed in the weekly chart many times before could be playing out. Today, price rose strongly on the back of higher volume as a long wickless white candle was formed. Price was $1.60 at the open and $1.69 at the close.


Positive divergence between declining price and the MFI is quite obvious on the daily chart now. Price would likely continue higher in the next session with immediate resistance provided by the declining 20dMA at $1.73.

If the bulls are very strong, we could see $1.83, a formerly strong support tested as resistance this time round. $1.83 is also where the declining 50dMA is approximating.

Related post:
CapitaMalls Asia: Japanese properties are safe.

Please read this:
Help Japan and donate generously.

SPH: Time to utilise my CPF OA?

As a rule, I am very careful with my CPF money and first utilised the money in my CPF OA during the global financial crisis some two years ago. I used the money almost exclusively for the purchase of shares in SPH which is my favourite blue chip for its high yield.

I have divested all the shares bought using the money in my CPF OA as the market ran up last year. So, for some time now, my CPF OA has been 100% cash waiting for another opportunity to buy shares of strong blue chip companies again. Of course, I am keeping an eye on SPH.


SPH's share price has been retreating and in the last three sessions, trading volume was rather high. Technically, it looks very weak as the MACD completed a bearish crossover with the signal line in negative territory and the 20dMA completed a bearish crossover with the 200dMA.


If we look at the weekly chart, the longer term 100wMA has turned up some time back and is rising nicely. With price action having broken the support provided by the 50wMA, I would look to the 100wMA for support. For now, I like $3.60 as that is where we find the 161.8% golden ratio as well as the rising 100wMA.

It seems that the time to use my CPF OA to buy some shares of SPH could be drawing near.

Please read this:
Help Japan and donate generously.

Sabana REIT: 92.5c is near.

Sabana REIT is beginning to look attractive. "Sabana REIT has an aggregate leverage of 26.5% which is comfortable... Its NAV per unit is 99c... The estimated annualised DPU for 2011 is 8.63c and for 2012 is 8.67c." Read my analysis: Sabana REIT: Fundamental Analysis.


On 10 December, I said that 92.5c would probably be a strong support. Price touched 92.5c, missed my buy order and off it rose. The REIT closed at 93c per unit today and it seems that 92.5c is within reach once more.

However, 92.5c/unit now is probably different from 92.5c/unit back in December as broader market sentiments are decidedly more bearish. Having said this, I would still enter on the long side with a small position just to put my foot in the door if price should weaken further.

Related post:
Sabana REIT: Possibly bottomed.

Please read this:
Help Japan and donate generously.

AIMS AMP Capital Industrial REIT: Bought more at 19.5c.

There was a single transaction today where 14,600 lots were sold down at 19.5c. This was at 4.01pm. That wiped out the buy queue at 19.5c. I went in and bought more units at 19.5c shortly after. It was a bargain and I could not resist it.

Substantial shareholder, Dragon Pacific Assets Limited, on 16 Mar increased its stake from 11.41% to 11.65%. This is an increase of 5,274 lots. Today, it increased its stake to 11.98%. This is an increase of more than 7,300 lots. Insider buying is taking place as price declines, it would seem.

Could we not see 19c or 18.5c per unit? In this current market, we could. Sentiments are still very negative and people do become irrational in times like this. I already have a buy queue at 19c.

Related posts:
AIMS AMP Capital Industrial REIT: Bought more at 20c.

Please read this:
Help Japan and donate generously.


Monthly Popular Blog Posts

All time ASSI most popular!


Bloggy Award