The email address in "Contact AK: Ads and more" above will vanish from November 2018.

PRIVACY POLICY

FAKE ASSI AK71 IN HWZ.

Featured blog.

1M50 CPF millionaire in 2021!

Ever since the CPFB introduced a colorful pie chart of our CPF savings a few years ago, I would look forward to mine every year like a teena...

Past blog posts now load week by week. The old style created a problem for some as the system would load 50 blog posts each time. Hope the new style is better. Search archives in box below.

Archives

"E-book" by AK

Second "e-book".

Another free "e-book".

4th free "e-book".

Pageviews since Dec'09

Financially free and Facebook free!

Recent Comments

ASSI's Guest bloggers

Raffles Education: Resistance at 200dMA.

Friday, January 7, 2011

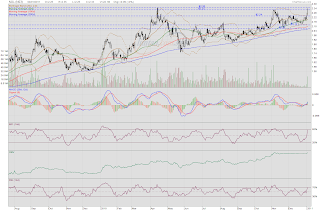
Raffles Education extended gains yesterday and closed at 30c, the resistance provided by the 200dMA. A wickless white candle was formed on the back of increased volume. OBV rose steeply, signalling accumulation. MACD rose into positive territory, signalling the return of positive momentum.


MFI and RSI rose higher, crossing into overbought territories. Although signalling heightened demand and positive buying momentum, the indices, being in overbought regions, suggested that further gains could be limited. This panned out today.


A doji was formed today, suggesting indecision. Although the momentum oscillators continue to rise, the OBV has flattened, signalling a stop to accumulation. The explosive rise in price could be at an end. Pull back could find support at 27.5c and 26.5c, as provided by the 100d and 50d MAs, respectively.

Related post:
Raffles Education: Sold at 27.5c resistance.


FSL Trust: Sold some at 48c.

Yesterday, I reduced my long position in FSL Trust at 48c, locking in some gains. You might remember that I sold some on 30 Dec at 47c. Then, I mentioned that "In a benign situation, I expect gap resistance at 46c to become support in the near term. This is further strengthened by the uptrend support line. Technically, the worst seems to be over for FSL Trust and a retest of resistance at 48.5c looks likely in time." 48c is just one bid away from 48.5c and selling some at 48c is a hedge in case price weakens.


A doji was formed yesterday, suggesting indecision, while the uptrending MFI broke its support when it emerged from the overbought territory a day earlier. Encouraging though some technicals might be with the MACD continuing to rise and the OBV showing no signs of distribution, the RSI was way overbought.

My long position in FSL is for a trade and the entry was not based on fundamentals, which are lacking. So, reducing my long position, locking in gains at resistance and at signs of weakening demand, at least partially, is prudent although it could limit gains in case of further price appreciation.


Today, 48c remains the resistance as a gravestone doji was formed. The stalemate between bulls and bears is obvious but it seems as if the bulls are tiring. Further upside seems difficult and could be limited to a retest of the high of 48.5c touched on 21 Oct 10. A pull back would see immediate support at 46c which is also where the 20dMA is rising to form a golden cross with the declining 200dMA.

Related post:
FSL Trust: Sold some at 47c.

What are the charts forecasting for 2011?

Wednesday, January 5, 2011

When I initially started out on Technical Analysis, I would see how seasoned chartists like Michael Kahn, Goola Warden and Daryl Guppy read the charts. So, I am excited that Daryl Guppy will be sharing his views on the stock market outlook for Singapore investors in 2011 very soon.

Daryl Guppy is a regular commentator on CNBC Asia and is known as 'The Chartman'. He is recognized globally for the quality of his analysis. He actively trades equities and associated derivatives markets. Daryl has also developed several leading technical indicators used by traders, and is recognized as an expert on China markets.

We can also learn how to use SiMSCI warrants to take a leveraged view on the Singapore market without the need to stock pick.


Register today at 
http://www.warrants.com.sg/en/seminar/seminar_e.cgi

More on SiMSCI warrants at
http://singaporeanstocksinvestor.blogspot.com/2010/11/best-way-to-trade-singapore-index.html

ADVERTORIAL

AIMS AMP Capital Industrial REIT: Firm support.

The last time I blogged about this REIT was on 29 Dec and I mentioned the rising MACD. This is still valid today. The MACD is rising gently and seems on the verge of crossing into positive territory. With the longer term 100d and 200d MAs both rising, it would seem to be a matter of time before the resistance at the 50dMA is taken out. This is at 22c.


The MFI has been forming higher lows and would be testing 50% once more. If it overcomes this, it would mean an expansion in volume at the current price of 22c or higher. This is one counter that has very limited downside and a nice probability of trading to 25c (for an 8% yield). In the meantime, at 22c, its distribution yield is about 9.1%. I am accumulating.

Related post:
AIMS AMP Capital Industrial REIT: Rising MACD.

Raffles Education: Sold at 27.5c resistance.

On Monday, 3 Jan 2011, I mentioned "Raffles Education is rebounding in earnest. The MACD broke out of its downtrend and is rising while the MFI and RSI show positive momentum. OBV shows accumulation. Immediate resistance at 26c.  This is followed by 26.5 which is where we find the declining 50dMA. The most formidable resistance is probably provided by the 100dMA which is at 27.5c. The last time price tested the 100dMA was on 21 Sep 2010. For anyone looking to reduce exposure, selling at resistance in a downtrend is conventional wisdom."


Today, Raffles Education broke out of its downtrend which coincides with the declining 50dMA at 26.5c. This was on the back of higher volume. Closing at 27.5c is at resistance provided by the declining 100dMA. An intra day high of 28c was achieved, however, and if volume continues to expand with an upward push in price, the next significant resistance level is at 30c, which is where we find the declining 200dMA.

Could I have been too hasty in selling off my money losing position initiated a couple of months ago? I do not know but I recognise that, downtrend notwithstanding, the 100dMA has been the limit of any rebound the counter has staged for the last 12 months. Could it be different this time? Of course, it could be but this being purely a trade, I chose to follow conventional wisdom.

Tea with AK71: Uncles fight on SBS bus.

I thought this only happens in Hong Kong.


I think I have taken the same bus service from Orchard Road to Chinatown before. I remember that the bus was mostly filled with senior citizens. I would never have thought such a scene probable.  Really, I mean these are not teenagers from 369, right? Does SBS have a service number 369?

NOL: Full steam ahead.

NOL tested its high of $2.35 touched in April 2010. The difference is that in April, it was a black candle and in the last session, it was a white candle. I like what I see in the OBV. It has been placid since early November 2010 as price went on to form two dips. No visible distribution. The weaker holders were being shaken out.


Taking the lows of $2.02 and $2.12, using $2.24 as the neckline gives me two targets at $2.36 and $2.46. $2.35 is only 1c shy of $2.36. I expect $2.46 to be attainable if volume continues to expand on upmoves. Having said this, price climbs a wall of worries and the MFI and RSI are bordering on overbought. It would make sense to divest partially and take some profit at resistance. Good luck to all NOL shareholders.

CapitaMalls Asia: Eyeing $1.83.

As mentioned in my last post, I am keeping an eye on CapitaMalls Asia. Price formed a wickless black candle today as it closed at $1.87 on higher volume. Support was established at $1.83 and it would be interesting to see if this would be tested in the next couple of sessions. If tested on lower volume, it could possibly signal the formation of a bottom.


Coupled with a lower volume, we want to see the MACD forming a higher low and the MFI keeping above its trendline support. We would then have the ingredients for a possible reversal. As of now, the downtrend is still intact and if downward movement in price continues with higher volume, things could turn ugly.

Capricorn effect, Golden Agriculture, CapitaMalls Asia, Raffles Education and Saizen REIT.

Monday, January 3, 2011

The mountain trekking herbivore did not disappoint as it showed its presence today, sending the STI up by 1.4%. Stock markets in Europe are also higher. "The biggest Asian markets closed higher, as investor confidence was boosted by signs that China's efforts at keeping a lid on inflation may be working....Hong Kong's Hang Seng index rose 400.60 points, or 1.7 percent, to close at 23,436.05, while the South Korean Kospi rose 19.08 points, or 0.9 percent, to finish at 2,070.80." Read article here.

Golden Agriculture moved higher to close at 82c today. Volume although higher is still quite modest. Nonetheless, the bullish crossover on the MACD, breaking out of its downtrend, is encouraging.  The OBV shows continual accumulation while the RSI shows positive momentum.  The MFI, however, has declined below 50%.  MFI is a function of price and volume and the decline reinforces the picture of negative divergence. Support for Golden Agriculture is now a band between 78c to 80c.


CapitaMalls Asia retreated from $1.95 where we find the downtrend resistance line. The counter's downtrend is intact. At the closing price of $1.91, it is supported by the 20dMA. If the support at the 20dMA were to be compromised, the low of $1.83 would be critical as a measure of whether the counter could reverse from its downtrend or go lower. I would keep an eye on the MFI. With a reduction in price and/or volume, the MFI could retest its support.


Raffles Education is rebounding in earnest. The MACD broke out of its downtrend and is rising while the MFI and RSI show positive momentum. OBV shows accumulation. Immediate resistance at 26c.  This is followed by 26.5 which is where we find the declining 50dMA. The most formidable resistance is probably provided by the 100dMA which is at 27.5c. The last time price tested the 100dMA was on 21 Sep 2010. For anyone looking to reduce exposure, selling at resistance in a downtrend is conventional wisdom.


Saizen REIT saw some buying up activity today. Volume achieved was the highest in 3 months on a white candle day. The MACD shows that momentum is positive and improving. OBV shows gradual accumulation. Immediate resistance is at 17c while 17.5c is the top of a basing process that started in April 2010. We could experience strong resistance at 17.5c if ever tested. With the next distribution in March 2011 and probable positive catalyst from the refinancing of YK Shintoku, there is more upside potential for this REIT.


SRS: E-book and a brief analysis.

Sunday, January 2, 2011

UPDATE (YA 2018):
Taxpayers who make SRS contributions on or after 1 Jan 2017 should note that the overall personal income tax relief cap of $80,000 applies from YA 2018 (when the income earned in 2017 is assessed to tax).
Read: SRS INCOME TAX RELIEF.
Feb 16, 2017
See examples:
https://www.iras.gov.sg/irashome/Individuals/Locals/Working-Out-Your-Taxes/Deductions-for-Individuals--Reliefs--Expenses--Donations-/#title7


----------------------------

SRS e-book
Recently, I came across a couple of blogs talking about the Supplementary Retirement Scheme (SRS). 

Over the years, whenever I talked about how I started an SRS account from the time the scheme was introduced in 2001, listeners would be incredulous. I was only 30 years old in 2001. To me, the tax benefit was too obvious to be ignored. Since 2001, I have contributed to my SRS account up to the maximum sum allowed yearly.


In a blog post on 24 Dec 2009, I mentioned that "As long as a person is paying income tax, he should start an SRS account and contribute to it yearly so that he pays less income tax (or none at all). For me, it's that simple.

Well, it might be that simple for me but for people with many financial commitments, it might not be so. For these people, they might not have much money leftover after taking care of all their routine expenses. So, voluntary contributions to the SRS account could be difficult.

Having said this, as long as we are paying income tax, voluntary contributions to our SRS accounts should be viewed as an important part of planning for our retirement. We should try to include it in our retirement planning.


Voluntary cash contributions to the SRS account are eligible for tax relief. For some, contributing just a few thousand dollars a year could mean not having to pay any income tax. So, there is no need to contribute the maximum of S$11,475 per annum. This is the maximum allowed for Singaporeans and PRs.

Therefore, I would suggest that we look at how much of our income is taxable and to contribute to the SRS account sufficiently to become free from income tax. After all, funds in the SRS account should not be withdrawn till the statutory retirement age to avoid penalties. So, cash in hand is still better than being in the SRS account.


Of course, if our taxable income is much higher, contributing the maximum sum allowed would save us much in income tax although it might not mean being free from income tax. How much to contribute, if ability allows, therefore, depends on individual income levels.

Money in the SRS account could be used to invest for higher returns. Examples are fixed deposits, single premium insurance policies, shares, REITs, ETFs and unit trusts. SRS funds cannot be used for purchasing real estate, for example.


Upon reaching the statutory retirement age of 62, if we had been making regular contributions and investing prudently, money in our SRS accounts could be an important part of our retirement income. 50% of the funds withdrawn upon retirement would be subject to income tax. If we keep our yearly withdrawal within the non-taxable bracket which I believe is $20K, we would not even have to pay any income tax.

So, theoretically, if we had $200K or less in our SRS accounts by the time we retire, withdrawals could be non-taxable. Withdrawing the funds in ten equal portions over a period of ten years would lower the income tax payable if we had more than $200K in our SRS accounts by the time we retire.

For anyone paying income tax yearly and still wondering if the SRS is necessary, do consider the points I have made in this blog post. Financial security in our old age is one of the most important things we have to plan for in life.


UPDATE (18 July 2014):
The maximum contribution allowed for the SRS account now is $12,750 per annum.

NEW: From 2016, max contribution is $15,300.

Read Supplementary Retirement Scheme.
Updated Booklet on the SRS: HERE.


From the FAQ section on SRS in MOF's website.

Update:
"... the caps on contributions to the Supplementary Retirement Scheme will also be raised to $15,300 for Singapore citizens and permanent residents and $35,700 for foreigners."Source: The Straits Times, 23 Feb 15.

Related post: Double your income, not your income tax.

A movie: Pirates of the Caribbean 4.

I just came across this. When I watched part 3, I was wondering if there would be a part 4. I enjoyed all three parts so far and Johnny Depp is one of the best actors around. He is Captain Jack Sparrow.  I cannot imagine anyone else in the role. Part 4, I will have to watch. Enjoy the trailer:


First REIT: Excess rights allotment.

Friday, December 31, 2010


On 29 Dec, I blogged about how First REIT's rights issue was a resounding success.  From the comments and emails so far, it seems that First REIT favours smaller investors for this rights issue.

See comments in the blog post here.

I have arrived at the following hypothesis based on the data collected so far:

1.  Entitled rights: 5,000 to 8,750,
excess rights allotted: 1,000.

2.  Entitled rights: 10,000 to 38,750,
excess rights allotted: 2,000.

3.  Entitled rights: 40,000 to 98,750,
excess rights allotted: 3,000.

4.  Entitled rights: 100,000 to ???,???,
excess rights allotted: 4,000.

I don't have data for entitled rights below 5,000 and beyond 100,000.

Of course, holders of odd lots would have the advantage of rounding up odd lots, be it 250, 500 or 750 units. These would add to the excess rights allotted.

I welcome more comments and feedback on whether my hypothesis is correct. Congratulations to fellow First REIT unitholders successful in getting excess rights.

SINGAPORE : Singapore's healthcare real estate investment trust First REIT on Friday said it has completed the acquisition of two Jakarta hospitals.

The two new Indonesian healthcare properties include the Mochtar Riady Comprehensive Cancer Centre as well as Siloam Hospitals Lippo Cikarang, a six-storey hospital that began operations in 2002.

With these acquisitions, First REIT said it has crossed a significant milestone as its assets under management have almost doubled to S$612.8 million as at December 31.

The trust's manager revealed that it aims to achieve a portfolio size of S$1 billion in two to three years...

...Meanwhile, the manager of First REIT revealed that based on projection year 2011, the trust's gearing level will stand at about 17 per cent, which is significantly lower than the regulatory limit of 35 per cent.

The manager of the trust added that this will provide it with sufficient headroom for future accretive acquisitions, and it will continue to look out for other healthcare-related assets in Asia to further raise its asset base. 

Complete article here.

FSL Trust: Sold some at 47c.

Thursday, December 30, 2010

I shared on 21 Dec that I had an eventual target of 47c for FSL Trust, saying that it would close the gap at 46c which it did on 23 Dec. Gap resistance was later taken out on 29 Dec. As price opened at 47c today, my overnight sell queue was partially filled. Could we see the 21 Oct high of 48.5c tested next?


With the MFI and RSI both in overbought regions, further upside from the current level could prove difficult. Although momentum is clearly positive as suggested by the rising MACD in positive territory, the light trading volumes as price rose suggest a lack of sellers and not an abundance of buyers. Sustainability is in question.

In a benign situation, I expect gap resistance at 46c to become support in the near term. This is further strengthened by the uptrend support line. Technically, the worst seems to be over for FSL Trust and a retest of resistance at 48.5c looks likely in time.

Related post:
FSL Trust: Closing the gap soon?

AIMS AMP Capital Industrial REIT: Rising MACD.

Wednesday, December 29, 2010

The MACD on this chart has stopped declining.  In fact, it seems to be rising gently, forming higher lows. Higher lows were spotted earlier on in the MFI which suggests firm underlying demand.


The rising 200dMA is at 21c and this, in my opinion, would provide very strong support. Immediate support is at 21.5c while immediate resistance is at 22c.  The downtrend line connecting the highs of 17 Sep and 19 Nov suggests that strong resistance is to be found at 22.5c in the current timeframe.

A quick check on the weekly chart confirms strong support to be at 21c and that the longer term trend is up. I bought more today at 22c and would continue to accummulate on weakness.

Related post:
AIMS AMP Capital Industrial REIT: High yield with limited downside.

First REIT: Excess rights not enough.

First REIT's rights issue is a resounding success. Valid acceptances at 97.7% which means there are not many excess rights to go around. Of the 7,790,838 rights which were not validly accepted, rounding up of odd lots would have priority. Seeing how there are 88,002,026 excess rights applied for, chances are most of the funds would be refunded to those who applied for excess rights. This includes me.

Rights units would be issued on 30 Dec and will start trading on SGX Main Board on 31 Dec.

Read announcement here.

I believe that there is some fear that First REIT could see a fall in price when the rights units start trading as people cash in their excess rights for a 40% capital gain. Personally, I do not think that very probable. If priority is given to people who need to round up odd lots, how much excess rights would they be able to sell to realise this gain? With such an overwhelming number of excess rights applied for, each unit holder who did apply for excess rights could end up with one or just a few lots of excess rights.

Personally, if I were successful in getting any excess rights at all, I would hold on to them for an estimated yield of 12.8% (6.4c/50c). I would also hold on because I believe the fair value to be closer to 80c (for an 8% yield). I won't be in a hurry to sell.


Having said this, Mr. Market is unpredictable mostly. Price is currently at support provided by the 20d and 50d MAs at 70.5c. In case of a pull back, expect support at 69c, as provided by the rising 100dMA.

First REIT's management also announced that its existing portfolio has been revalued at $355.5 million, an increase of $14.6 million from the end of 2009. This means that NAV for the REIT is now higher by some 4.3% and this would also lower its gearing level a bit. Good news.

Related post:
First REIT: XR and fair value.

Golden Agriculture: Testing resistance at 80c.

Tuesday, December 28, 2010

The negative divergences on the charts have been there for some time now. However, price continues its levitation act as it retested resistance at 80c today.


In the shorter term, it would make sense to wait for price to pull back to the 20dMA at 77c before loading. Personally, I would wait for a retest of the 50dMA before loading up. Would there be a catalyst for a stronger pull back? If I miss out on this one, then, too bad for me.

Indonesia will raise a tax on crude palm oil exports to 20% for January from 15% this month, an official said late Monday (27 Dec). Trade Ministry Director General of International Trade Deddy Saleh told reporters that the reference price for CPO will be US$1,118.37 a metric ton. (CPO closed at US$1,221 on 28 Dec.)  -By Joko Hariyanto; contributing to Dow Jones Newswires

Related post:
Golden Agriculture: Pulling back.

CapitaMalls Asia: Rising on low volume.

CapitaMalls Asia closed closed at $1.91 today, up 2c. The MACD's bullish crossover is following through as it continues rising above the signal line. Being still in negative territory, this could just be a rebound. However, the higher lows on the MFI and RSI suggest firm underlying demand and buying momentum.


Immediate resistance is at $1.92 which is where the declining 20dMA is approximating.  If this is taken out convincingly, next resistance level is at $1.95 followed by the downtrend resistance at $1.97. Closing above $1.97 would break the current downtrend. Support at $1.83 has been established.

Related post:
CapitaMalls Asia: Reversal?

Market malaise and First REIT.

Monday, December 27, 2010

I guess it is safe to say we can take the whole week off and we would not be missing anything. The STI rose 15.56 points on thin volume (total value of S$559.8m) to close at 3,159.36. Thankfully, I was rather busy at work today. Otherwise, I might have been quite bored.

So, what am I looking at in the stock market now? Apart from thinking of what would I be doing in 2011, nothing much. Actually, I have started writing but I am still adding some finishing touches to the blog post. I would definitely put it up before the end of the week. Look out for it.

However, there is one counter that is on my mind: First REIT. It would complete issuance of the rights units (including excess rights) on 30 Dec (Thursday) and the rights units would start trading on 31 Dec (Friday). At an exercise price of only 50c, successful applicants of excess rights would make approximately 40% capital gain immediately!


Related post:
First REIT: Dragonfly doji at 71c.

MERRY CHRISTMAS!

Saturday, December 25, 2010

A photo of the Helix Bridge I took a few evenings ago as I took a walk from MBLM to Millenia Walk. Yes, it was a long walk but it was a cool evening. I rather enjoyed the walk. :-)

See the Singapore Flyer in the background on the right?  I am quite proud of this photo taken with my free Samsung mobile phone's built in 5 megapixel camera. ;-p


Merry Christmas to one and all!

Tea with AK71: ASSI turns 1.

Friday, December 24, 2010

My blog is one year old! Who would have thought that starting this blog out of curiosity exactly a year ago could have resulted in what we see today? I wouldn't dare say that I will blog for years to come but I will definitely continue as long as I still feel happy doing it. :-)

A birthday cake for ASSI:


Actually, it's my own birthday cake as I turned 39 earlier this month and, guess what, it was with compliments from GNC. Free and yummy birthday cake. I like. ;-)


Related posts:
Tea with AK71: Buy me a cuppa tea?
Planning to travel? Check out ZUJI.

Japanese properties attracting international buyers.

Thursday, December 23, 2010

International real estate portfolio investors from the United States to Singapore are increasingly looking to buy property in Japan with over $2 billion in deals already agreed this year, it is claimed....

............Franklin Templeton is understood to be looking to buy a portfolio of distressed loans at a discount, which would provide attractive returns and allow access to physical assets, while Blackstone plans to buy Morgan Stanley’s loans which are backed by commercial real estate such as office buildings.
 
Wealthy Chinese investors are also increasingly looking to Japan and a number of travel agencies have started offering Buy Japanese Property tours. Realtors say major foreign private equity groups, real estate trusts and realtors have earmarked an estimated $6.6 billion for investments in Asia, showing interest in Japan’s bricks and mortar assets and property debt.
 
‘While we are cautious around the country’s fundamentals, we do believe that the sheer size of the market allows for opportunities,’ said Peter Kim, managing director, ING Real Estate Investment Management, which has funds invested in Japan......

........Distressed or marked down properties in Japan, such as debt backed by commercial real estate, are also emerging on the radars of foreign buyers. ‘We are finding a degree of success in finding deals through trust banks or lenders who have taken control of over leveraged assets,’ said Jacques Gordon, global investment strategist at LaSalle Investment Management.
 
As foreign money pours in, the real surge in buying may just be starting, according to Mark Brown, a real estate analyst at researcher Japaninvest. The gap between what distressed property owners are asking and the amount buyers are willing to pay is closing fast, he said, adding that would lead to plenty of new deals. 


Source: PropertyWire

Related post:
Japanese real estate: Has it bottomed?

AIMS AMP Capital Industrial REIT: High yield with limited downside.

The very low trading volume these days probably affirms talk that most traders are taking the rest of the year off. There is also not much to say with regards to the counters on my watchlist. Most are behaving in ways which I think they would be behaving.


I decided to take a look at AIMS AMP Capital Industrial REIT which has been holding steady for some time now. I like this REIT for its relatively high yield. However, price has been trapped in a tight range between 21.5c and 22c for many sessions now. What direction would it take in future?

The OBV is generally flat while the MACD has declined into negative territory. Although momentum has turned negative, volume is drying up. It is very likely that this counter could be trading sideways for some time to come. With the rising 200dMA at 21c, downside could be pretty limited. If the 200dMA were ever tested as support, I would probably buy more.  With an expected DPU of 2c in 2011, buying at 21c would mean a yield of 9.52%. All in good time.

Related post:
AIMS AMP Capital Industrial REIT: Revised DPU and fair value.

CapitaMalls Asia: Reversal?

Wednesday, December 22, 2010

CapitaMalls Asia (CMA) is buying Queensbay Mall in Penang. I have been to this mall a few times on cruises to Penang and Phuket. I think it is the nicest mall in Penang: new, spacious, clean and cool. However, everytime I went there, I would wonder how the shops survived. It was also very quiet.

CMA's chart looks similar to that of Raffles Education: a prolonged downtrend with a white candlestick reversal signal as well as higher lows formed on the MFI as it rises from the oversold region.


The descending 20dMA is approximating $1.95 and should provide resistance. In case this were taken out, the descending 50dMA at $2.06 would be the next significant resistance level. In a downtrend, sell at resistance and that is what I would probably do.

Related post:
CapitaMalls Asia: Rebounding from $1.83


Raffles Education: White hammer.

Bullish reversal candlesticks in this counter's chart have a notorious reputation of lacking follow throughs. So, the reliability of the white hammer formed this session is suspect. Nonetheless, downtrends are rivers of hope and rebounds are not unusual.


The MFI, a measurement of demand, has risen from the oversold region. It has formed a higher low for the second time in the last fortnight. Volume has expanded as price stabilised or rose. This is a sign of underlying demand. Could we see demand improving to push the price higher?

Immediate resistance at 25.5c. Further upside could be limited as resistance is expected at 26.5c, a many times tested support turned resistance, and 27c, where we find the descending 50dMA and the downtrend resistance line.

First REIT: Dragonfly doji at 71c.

Tuesday, December 21, 2010

The bulllish harami identified on 14 Dec delivered most sportingly as I said then, "It is my personal belief that the 200dMA support at 67c has been recaptured.  Further upward movement in price would find immediate resistance at 68.5c.  This will be followed by 70c and 71c. In due course, if these resistance levels were cleared, the counter could cover the gap at 73.5c. There are some who are still waiting to see how low the price could fall before buying in. Their hands could be forced in the next two days if price continues to be resilient and this would contribute to a further strengthening in price."

First REIT's trading volume has reduced markedly as price rose higher in recent sessions. Today, price closed at 71c, forming a dragonfly doji, suggesting a lack of selling pressure as price rose on relatively low volume.


The OBV formed a sharp V since the formation of the bullish harami candlestick pattern. It has continued rising but more gently so. Accumulation continues. The MACD is poised to form a bullish crossover with the signal line, although in negative territory. Could this upmove in price be just a rebound?

I am of the opinion that it is more a recovery from a deeply oversold condition. Valuation is now moving towards fairer levels. In the days ahead, we could see a gradual rise in price and it could cover the gap at 73.5c. A retest of 75c, the adjusted historical high would be next in line.

Not so long ago, during the days of mad selling down which saw the rights touched a low of 16c and the mother shares touching a low of 66c, what was presented to us was a window period of a few days to load up on the cheap.

Only with strong confidence that comes from knowing the sound fundamentals of the REIT would we dare to buy more and I said as much when asked what would I do then. Friends sent SMS, readers left comments and sent emails. To all, I said we should recognise the window of opportunity, ignore the noise and buy more which I did.

"Am I not worried whether the price would decline further? No. Why should I worry? I cannot do anything to influence the price movement of the REIT. If the market is willing to sell a good thing to me at a lower price, I would buy. It's simple. So, would I buy again if the price declines further. Yes, I would." 13 Dec 10.

I could be sticking my neck out by saying this but congratulations to all who conquered their fears and held their positions. In my opinion, the fair value for First REIT remains at 80c /unit.

Related posts:
First REIT: Quiet confidence.
First REIT: XR and fair value.

FSL Trust: Closing the gap soon?

On 17 Dec, I mentioned that "The MACD is about to cross into positive territory. OBV suggests continuing accumulation. MFI and RSI are both rising, suggesting strengthening demand and buying momentum."


The resistance provided by the 50dMA at 45c was taken out today as price closed at 45.5c. With the MACD rising into positive territory, we could indeed see the gap closed at 46c next. Eventual target remains at 47c.

Related post:
FSL Trust: Testing 45c resistance.

Healthway Medical: Closed the gap at 15.5c.

Monday, December 20, 2010

On 13 Dec, I divested my trading position in Healthway Medical at 17c, saying that "I expected 17c to be a strong resistance as it is where we find the merged 100d and 200d MAs as well as the downtrend resistance line.  So, a trading position entered on 22 Nov last month at 15.5c was divested at 17c today." and on 14 Dec, I mentioned that "Price could first retreat to 16c, a many times tested resistance and now possible support, before closing the gap at 15.5c."


Healthway Medical closed the gap today at 15.5c. Am I expecting more downside? Share price is pulling back from almost overbought conditions and I do not expect any huge downward movement. Notice that the decline in share price has been on the back of reducing volume. This is good news for the bulls. Also notice that the uptrend in the MFI and RSI are still intact. However, the charts suggest the possibility of both indices to retest their supports. This could mean a reduction in price or volume or both in the near future. A successful retest of supports could lead to another upward movement in price.

Immediate support at 15.5c.  This is followed by 15c and 14.5c.

Related post:
Healthway Medical: Still at resistance.

SPH: Breaking the 100dMA.

A reader recently asked me at what price should he buy more shares of SPH? Well, I always like to buy on weakness. Today, SPH closed at $3.90.  This was after breaking the support provided by the 100dMA at $3.95 last Friday.


Although the MACD is in decline, the MFI suggests that there is some support as the counter gets sold down. Of course, this could change quickly.  In such an instance, using Fibo lines, we see the next support at $3.86. However, the 138.2% Fibo line at $3.83 should be a stronger support being one of the three golden ratios. This is followed by $3.81 and $3.79.  I could add to my position then.

CapitaMalls Asia: Rebounding from $1.83.

Last Friday, I mentioned that "A short term positive divergence is what I see with higher lows on the MFI and the RSI as price declined. As price has been pushing the borders of the lower Bollinger and is some distance from the 20dMA, we could expect a brief respite from further downward pressure."


Today, a white candlestick was formed with price rebounding to close at $1.87. The relatively low volume suggests that the mood is still cautious and the rebound could simply be a technical one as the counter was oversold.

There could, however, be more room for price to rise as the MFI and RSI both formed higher lows, enhancing the picture of a positive divergence with price movement. A buy signal has also appeared on the MACD histogram while OBV turned up signalling an end to distribution which has been taking place since 13 Dec.

This counter is still in a downtrend and selling at resistance is the prudent thing in a downtrend. I see immediate resistance at $1.92.  This is followed by $1.95 and $1.97.

Related post:
CapitaMalls Asia: Closed at $1.84.

Golden Agriculture: Pulling back.

In various recent blog posts, I mentioned that the negative divergence between indicators and the price movement of Golden Agriculture is too glaring to be ignored. The charts show clearly rising price against a backdrop of declining volume, MACD, MFI and RSI.


Of course, the MACD is declining in positive territory and the weakness in price could be a chance to accumulate at support. I see support provided by the rising 50dMA which approximates 72c. This is followed by 70c.

Related post:
Golden Agriculture: Waiting for a pullback.

Tea with AK71: Love the plants.

Sunday, December 19, 2010

This was taken at a Chinese dessert place at Vivo City. I guess the shop owner must be either a humorous guy or he got quite tired of having to replace the plants! Be kind to plants!

Saizen REIT: Steady.

Saturday, December 18, 2010

I have not been doing much TA on Saizen REIT and some readers are worried. OK, let me do an update.


Saizen REIT has settled into a tight trading range. All the daily MAs are within close proximity of each other. The technicals are benign. MFI is forming higher lows and higher highs. OBV shows some accumulation.


Look at the weekly chart and the picture is more exciting. 20wMA has flatlined. The 50wMA continues to rise which reduces the capping pressure on upward price movement. The 100wMA continues to rise strongly and this limits further downside and could also provide a push to the unit price.

The MACD is poised to cross over into positive territory. The higher lows on the MFI are equally obvious on the weekly chart. All technicals point to an improvement in longer term sentiments.

Things could only get better in time.

Here is a link contributed by a reader, DP:
Japanese property market on the rise.
Click on Listen:Windows Media for a radio broadcast which we could listen to as well.

Related post:
Saizen REIT: Insider buying continues.

FSL Trust: Testing 45c resistance.

Friday, December 17, 2010

FSL Trust is rising on pretty modest volume. It closed at 45c which is the resistance provided by the 50dMA today. Could it move higher?


I suggested that the counter could close the gap at 46c which could indeed happen. The Bollinger Bands are beginning to widen after squeezing tighter and tighter in the recent past. This usually hints of a break from a tight trading range and could have some momentum.

The MACD is about to cross into positive territory. OBV suggests continuing accumulation. MFI and RSI are both rising, suggesting strengthening demand and buying momentum. If this keeps up, we could see the declining 200dMA, currently at 47c, as the eventual target. Immediate support is at 44c.

Related post:
FSL Trust: Higher volume and testing resistance.

CapitaMalls Asia: Closed at $1.84.

The support identified at $1.85 was broken yesterday but recaptured. Today, price closed at $1.84. Do we hit the panic button, sell and run for the hills?


The black candlestick formed today was on the back of lower volume, less than half of yesterday's volume. Selling pressure is still around as suggested by the long upper wick of the candle. However, with price closing only 1c lower, it suggests that the bulls are putting up a fight here. The bears are not as strong as yesterday but still have the upper hand.

A short term positive divergence is what I see with higher lows on the MFI and the RSI as price declined. As price has been pushing the borders of the lower Bollinger and is some distance from the 20dMA, we could expect a brief respite from further downward pressure.

Connecting the highs of 10 Nov and 13 Dec gives us a steeper downtrend resistance line. This is where the declining 20dMA approximates. I expect some resistance at $1.95 in case of a rebound.

Related post:
CapitaMalls Asia: Bought some at $1.85.


Monthly Popular Blog Posts

All time ASSI most popular!


Bloggy Award