The email address in "Contact AK: Ads and more" above will vanish from November 2018.

PRIVACY POLICY

FAKE ASSI AK71 IN HWZ.

Featured blog.

1M50 CPF millionaire in 2021!

Ever since the CPFB introduced a colorful pie chart of our CPF savings a few years ago, I would look forward to mine every year like a teena...

Past blog posts now load week by week. The old style created a problem for some as the system would load 50 blog posts each time. Hope the new style is better. Search archives in box below.

Archives

"E-book" by AK

Second "e-book".

Another free "e-book".

4th free "e-book".

Pageviews since Dec'09

Financially free and Facebook free!

Recent Comments

ASSI's Guest bloggers

Showing posts with label FSL Trust. Show all posts

FSL Trust: Above the 20dMA.

Wednesday, July 7, 2010

FSL Trust, for the first time since 23 April, closed above the 20dMA which is currently at 38.5c. Bollinger bands are squeezing which indicates the possibility of a big move in either direction.  In this case, chances are the move would be positive.


Momentum oscillators continue to rise.  The MFI has formed another higher low as it rises above 50%.  Demand is back. RSI too formed a higher low which suggests that price is rising at a good pace. OBV is flattish which suggests a lack of heavy distribution.  Perhaps, the sellers are done selling.  MACD continues to rise above the signal line but is still in negative territory.  This could just be a rebound.  Although volume increased today, it is rather modest compared to the volumes on the black candle days which sent the price down to where it is today. Volume will have to expand more meaningfully in future sessions to try and push the price higher.

The low of 11 Jun at 36c could indeed have been the bottom.  However, we need confirmation in the next session that the 20dMA at 38.5c is indeed resistance turned support. Once confirmed, price could possibly rise to close the gap at 43.5c which approximates the declining 50dMA if momentum remains positive.

Related post:
FSL Trust: Land ahoy?

FSL Trust: Land ahoy?

Sunday, June 27, 2010

On 18 June, news of the release of Verona I was greeted with some relieve.  However, price has closed unchanged at 38c since. I expect Nika I to be eventually released as well but would this be enough to reverse the fortunes of FSL Trust's unit price?


Obviously, FSL Trust is still in a downtrend.  Is the current phase forming a floor or a base? Would the declining 20dMA push the price down further? These questions are hard to answer definitely.  However, TA can provide some clues as to the psychology of market participants.  Let's see.

The MFI has been rising since 7 May.  This happened as the price continued its decline. MFI is derived from the combination of price and volume. A rising MFI is a sign of demand as money flows into a stock. Looking back, the MFI was declining from March to April this year while the unit price of FSL Trust was rising.  That negative divergence was a warning sign as smart money was flowing out of the stock. Another reason why I was warning people to stay away from FSL Trust back then. The opposite is happening now with MFI rising, money is flowing back into the stock as price declined.

OBV has been rising since 11 June and this suggests that accumulation is back. All this while, the RSI has been more or less flat and hugging 30%, no longer oversold.  This suggests that the speed at which the stock is being sold down is very much slower or, indeed, has stalled.

Immediate support is a band between 37.5c to 38c.  Immediate resistance is at 40.5c.  If price retests the recent low of 36c, I would pay attention to the volume.  If it is much lower than what was achieved on 11 Jun (5.64m units), we could have the first hint of a bottom.

Related post:
FSL Trust: Verona I.

Charts in brief: 21 Jun 10.

Monday, June 21, 2010

Most counters in my watchlist are positive today as the STI gained to close just a whisker off 2,880. It would seem that the Chinese government has done the world a great favour by deciding to let the RMB strengthen. This is something I have believed should happen for some time. A stronger RMB would ameliorate the problem of inflation within China, raise the purchasing power of its people and improve standards of living. Increased domestic consumption would do a lot of good for China's own economy as well as the global economy. You might want to read what I wrote in an earlier post here.


AIMS AMP Capital Industrial REIT: Volume expanded today and all trades were done at only one price, 22c. MACD has turned up.  MACD histogram has a buy signal. MFI has turned up, forming a higher low. OBV has turned up, suggesting increased accumulation.


CapitaMalls Asia: Price broke the resistance band of $2.19 to $2.21 which I identified earlier. Closing at $2.22 seems bullish but volume suggests that this might not be durable. This counter is probably rising due to a lack of sellers rather than an abundance of buyers. Nonetheless, the momentum is still good as suggested by the MFI and price might be pushed higher.


Courage Marine: The picture is somewhat similar to CapitaMalls Asia.  A white candle day on improved volume but not impressively so which suggests a lack of sellers rather than an abundance of buyers. MFI shows improving momentum while the OBV has turned up slightly.  It remains to be seen if resistance at 20c could be taken out. A significant resistance after 20c is at 21c.


FSL Trust: MFI and OBV continue to rise. Could 40c be taken out this week? The next resistance level which is likely to be a strong one as suggested by candlesticks and a declining 20dMA is at 42c.


Golden Agriculture: Price continues to be resisted at 55c although it touched a high of 55.5c today. Momentum is still positive and MACD is about to cross into positive territory. Volume is, however, unimpressive which probably resulted in the failure to take out 55c and instead formed a white spinning top which is a possible reversal signal.  Support is at 51.5c in case of a trend reversal.


LMIR: It seems that the merged 100d and 200d MAs are too strong to be taken out today. Price closed at 47.5c which is where we find the 50dMA, forming an inverted cross in the process. The negative divergence between price and volume continues to suggest LMIR has been rising on weak technicals. If the 50dMA does not hold up as support, the next support is at 46c as provided by the 20dMA.


Related posts:
AIMS AMP Capital Industrial REIT: Big boys.
Courage Marine: Triple bottom?
Golden Agriculture: Resistance remains at 55c.
LMIR: Testing resistance.
FSL Trust: Verona I.

FSL Trust: Verona I.

Friday, June 18, 2010

Initially, the news that FSL Trust secured the release of Verona I was met with much bullishness and price was pushed to a high of 40.5c on the back of heavy volume.  By the end of the day, it closed where it started the day at 38c, forming an inverted cross.  This suggests that there is still much bearish sentiment here.  Once Nika I is released as well, we might see the unit price of FSL Trust bottoming in earnest.


MFI has risen and is testing 50% next.  This suggests some positive buying momentum.  The OBV has turned up quite vigorously which suggests some accumulation activity. The downtrend is still quite obvious and until its unit price moves above the declining 20dMA, the worst is not over for FSL Trust.

Major resistance at 42c, as provided by the declining 20dMA.  Immediate support is at 37.5c.  The waters are still murky for FSL Trust but it might be clearing up.


Charts in brief: 14 Jun 2010.

Monday, June 14, 2010

LMIR: Price continues to be resisted by the 50dMA at 47.5c. Volume was very low today and continues a picture of negative divergence between price and volume. As MFI rose gently higher, the OBV is flattish. This is not a bullish sign either.  Immediate support at 45.5c which approximates the position of the trendline support as well as the 20dMA.


AIMS AMP Capital Industrial REIT: A one lot buy up at closing prevented the formation of a gravestone doji. 21.5c has been established as the immediate support.  This REIT is still trading within a range and I would buy more if it trades closer to the support of the trading range at 20c.


CapitaMalls Asia:  Symmetrical triangle has yet to be resolved. Negative divergence between price and volume is glaring. MFI has been rising but OBV has been flattish. MACD is rising but is still in negative territory.  All these make the buy signal shown in MACD histogram suspicious.  $2.14 is the resistance to watch.


FSL Trust: I was wondering if this counter might form a bullish harami today.  Unfortunately, it's a gravestone doji. This counter is oversold.  In the event of a rebound, I see resistance at 39c and 44c.


Golden Agriculture: Nice up day.  We might see the price continue to rise tomorrow as there is respectable volume and price closed at the high of the day at 53c. Immediate support at 49c.  Immediate resistance at 55c.


FSL Trust: A crisis or an opportunity?

Saturday, June 12, 2010

I still have units of FSL Trust which were bought at an average price of S$1.00 per unit.  By any stretch of imagination, I cannot foresee FSL Trust trading at S$1.00 per unit in the next few years, if ever.  I have kept these units in a frozen portfolio together with a few other stocks to remind myself of the mistakes I made.

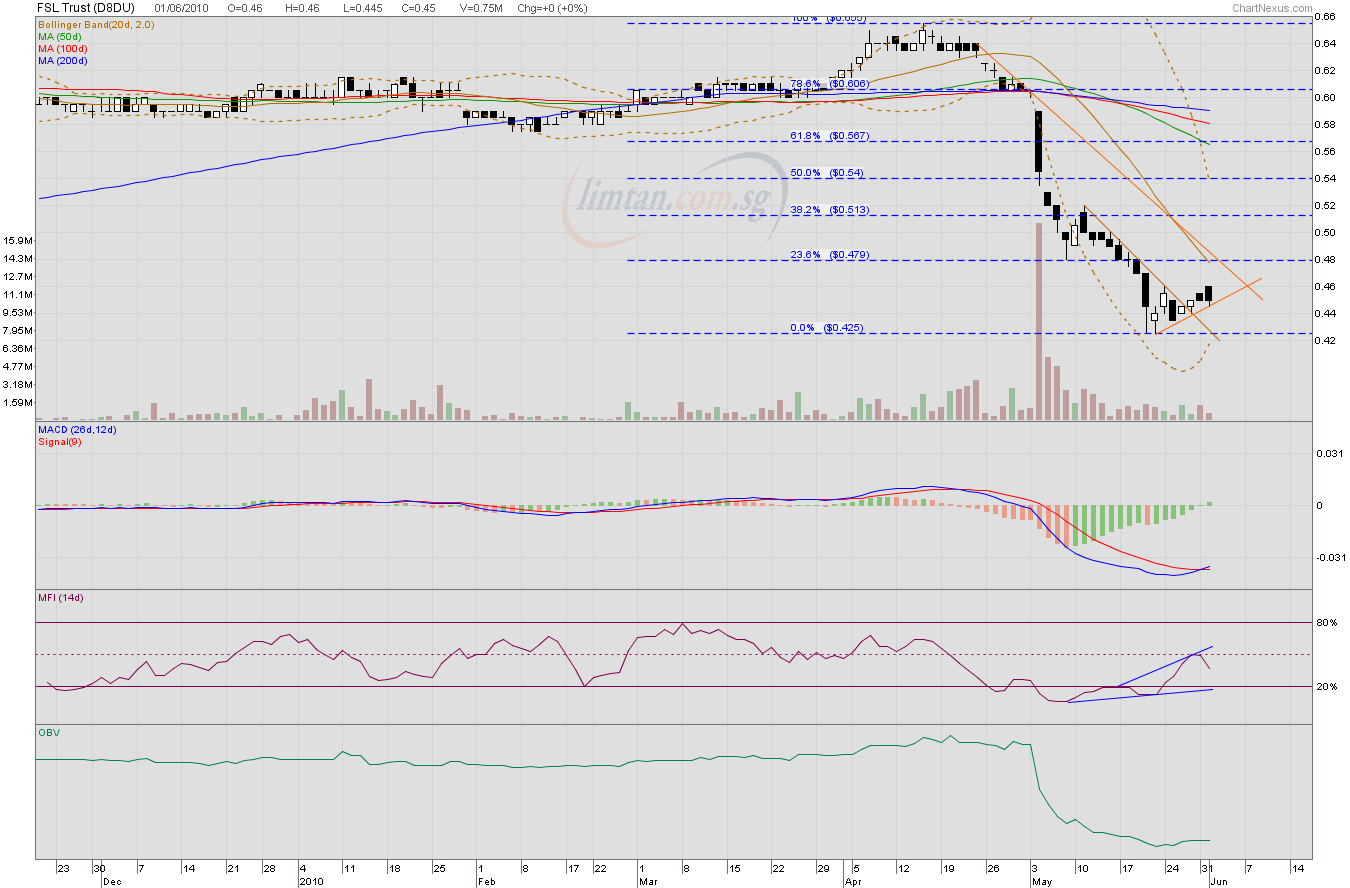
As FSL Trust enjoyed a recovery in unit price and was trading at an average of 60c for about a year till the first few days of May 2010, reaching a high of 69.5c in July 2009, I advised potential investors that it is still a risky investment. The primary reason why I consider FSL Trust to be a risky investment is its indebtedness.

As of 31 March 2010, it had bank loans of US$484.6m. This has been reduced to US$ 477.1m after another loan payment was made in April 2010. FSL Trust makes quarterly loan payments. About half of the loans will mature in April 2012 and the rest are maturing in March 2014.  Although its vessels are valued at US$826m, it only has US$56m in cash and cash equivalents as of 31 March 2010.

In 1QFY10, FSL Trust's revenue was US$24.43m.  The two ships which were leased to Groda, Verona I and Nika I, contributed 15% to FSL Trust's revenue.  Assuming a total cessation of contribution (which is not very likely), quarterly revenue would decline to US$20.77m. Then, assuming cost of operations remain the same and assuming that US$8m is used to make quarterly loan repayment as usual, what is left would be US$4.77m.  This could then be distributed to unit holders.  This would give a dpu of about 0.8 USc (or 1.08 Sc).

Based on the current unit price of 37c, the yield would be 11.68%.  If the unit price declines to test its historic low of 32c, the yield would be 13.5%.  Remember that this is based on the most abject scenario that contributions from Verona I and Nika I would cease completely.  That is why I said on 9 June: "It seems to me that a test of 32c as support would be overly pessimistic and if it should come to that, I would probably buy in again."

In all probability, FSL Trust would be able to secure the release of the two vessels by paying US$4.8m in total.  It would be able to fund this internally as it has US$56m in cash and cash equivalents. A resumption of operations of the vessels would continue to contribute to revenue although much reduced.

As of 31 March 2010, NAV is 62 USc per unit.  That is about 83.7 Sc (based on US$1 = S$ 1.35).  Buying at 37c represents a 56% discount to NAV while buying at 32c would represent a 62% discount to NAV.  Compared to buying at 60c, which represents a lesser 28.5% discount to NAV, there is a greater margin of safety now.

For sure, FSL Trust's high gearing is still an issue.  However, as its unit price continues declining, risk reward analysis suggests that it might be rewarding to enter with a long position.  I did so but was probably too early as I anticipated a bottoming of the unit price instead of waiting for clearer signs using TA.

Panic is still running high and fear is palpable, judging by the relatively high volume of trade as price declined. I am sure that there is no shortage of short sellers as well (please pardon the pun).  Once short sellers begin to cover their positions and once the last bearish investor throws up his arms in despair, we will see a reversal.  We must see a base forming and it would be ideal to see that base retested and holding.  That is a good time to add to long positions.  In crises, we find opportunities.  This crisis might just be an opportunity.

Related post:
FSL Trust: A new low.

Charts in brief: 11 Jun 10.

Friday, June 11, 2010

CapitaMalls Asia: A trading halt in the morning was called for as the sale of three malls to its REIT in Malaysia was announced. The response to this announcement was vapid. The symmetrical triangle has yet to resolve itself while the negative divergence between price and volume is still quite obvious.


AIMS AMP Capital Industrial REIT: Closed at 21.5c. MACD continues its decline and looks set to leave positive territory. Rising MFI suggests positive buying momentum while a falling OBV suggests distribution.  This divergence could limit upside in the near term.


FSL Trust: The decision to wait and see even as the price plunged two sessions ago has paid off. OCBC Research has terminated coverage of all shipping trusts and DBSV has advised avoiding FSL Trust for now. Using Fibo lines, we see that closing at 37c today is at the 123.6% Fibo line and if this should give way, price could decline to 33.5c as the 138.2% Fibo line is at 33.7c.


Healthway Medical:  Formed a doji today, unable to break the high of 19c as volume declined.  MFI peeked into overbought territory while OBV has flattened. The doji is a reversal signal but it needs confirmation although the technicals support a reversal. A correction downwards should find support at 16c, a many times tested support in the past.


LMIR: Closed above 47c resistance but is met with resistance provided by the 50dMA at 47.5c.  The candlestick formed today is that of a hangman.  The negative divergence between rising price and declining volume is still valid.  LMIR is rising on weak technicals.


FSL Trust: A new low.

Wednesday, June 9, 2010

On 7 Jun 10, I mentioned that FSL Trust "closing at 45c is below the trendline support in the short term. Could we be seeing the start of a bottoming process with 42.5c as the base and 46c as the neckline? Could we be seeing the start of a trading range with support at 42.5c and resistance at 46c? Although the MACD is above the signal line, it remains in negative territory. The MFI has peeked above 50% and the OBV is flattish. Selling pressure has abated. That much is obvious."

Then, news that Verona I, seized in Japan by Singapore-based Daxin Petroleum for not paying for bunker supplied by Daxin had muted response from market participants. Today, news that the other vessel, Nika I, also returned by Groda Shipping is arrested in Qingdao, China, by Daxin over the same reason sent FSL Trust's unit price plunging.

Fundamentally, I priced in a worst case scenario of a loss of 15% income as well as a 33% reduction in dpu from 1.5 USc per quarter to 1.0 USc per quarter.  Technically, it looked as if FSL Trust was bottoming and I bought some units as a hedge.  My recent purchases here demonstrate the danger of anticipation using TA rather than wait for firmer signs of bottoming or a trend reversal.

Now, the question is what would I do from here? Buy more? No, technicals are very bearish. Could it go lower? It might.  Sell and cut losses? No, not now when its price is forming a new low.


FSL Trust's unit price hit a historic low of 32c in March 2009 and at today's low of 39c, the price is only 7c away from testing that low. It seems to me that a test of 32c as support would be overly pessimistic and if it should come to that, I would probably buy in again.


Related post:
FSL Trust: Time to buy?

Charts in brief: 7 Jun 10.

Monday, June 7, 2010

FSL Trust: Formed a white hammer, closing at 45c after gapping down to start the day at 44.5c.  Closing at 45c is below the trendline support in the short term. Could we be seeing the start of a bottoming process with 42.5c as the base and 46c as the neckline? Could we be seeing the start of a trading range with support at 42.5c and resistance at 46c?  Although the MACD is above the signal line, it remains in negative territory. The MFI has peeked above 50% and the OBV is flattish.  Selling pressure has abated.  That much is obvious.


AIMS AMP Capital Industrial REIT: We have a sell signal on the MACD histogram. The MACD seems to be flattening as the signal line continues rising to catch up.  OBV is rounding from a peak although MFI is above 50% and rising gently.  Still, I would like to sell some at 23c, the top of the trading range but I might not get my wish.  Immediate support is at 21.5c.


SPH: The white spinning top formed last Friday was confirmed today as a reversal signal.  Price gapped down from the opening bell and did not once trade above the 200dMA at $3.72. All the technicals suggest that SPH is going to see more weakness in time. Volume expanded today as we have a sell signal on the MACD.  I was waiting to sell more at S$3.83 last week but that price did not happen.


CapitaMalls Asia: Although we have a white candle today, it was on reduced volume. The negative divergence between price and volume is obvious.  Sell signal seen on the MACD.  MFI has been forming lower highs in the short term.  OBV is lacklustre.  I still see a symmetrical triangle and this needs to be resolved.  Otherwise, the situation remains dicey although I believe there is a downward bias.


Charts in brief: 4 Jun 10.

Friday, June 4, 2010

FSL Trust: Bought some units at 45.5c today.  Volume shrank as price closed at 46c.  46c is still the resistance to watch. A semblance of stability has returned to this counter but its price is probably not going to rise in a hurry. MACD continues to rise above the signal line and MFI is testing 50% once more.


LMIR: Price closed at 47c above the 20dMA on low volume. We need confirmation that the 20dMA is resistance turned support. 47c is a many times tested support and should provide resistance.  I have sold some units at 47c to reduce my exposure. Next resistance level is at 48c which approximates the positions of the 50dMA and the 200dMA. The downtrend is still intact.


AIMS AMP Capital Industrial REIT: 22.5c. Very low volume. MACD has crossed into positive territory and MFI continues to rise above 50%. OBV has flattened at a high. I continue to queue to sell some at 23c, the top of the range.


Golden Agriculture: A doji formed today on very low volume. The downtrend is intact even as the MACD forms a bullish crossover with the signal line in negative territory. A lower high in the MFI tells of weak positive buying momentum. I have sold into strength and will wait for clearer signs of bottoming before going long again.


SPH: Volume continues to fall as price formed a white spinning top today, resisted by the 20dMA at $3.79. OBV is flat. MFI is moving to test 50%. The negative divergence between rising price and falling volume is quite clear to see (as with many other counters). I would like to to sell some SPH shares at $3.83 but without volume, it seems difficult.


Related post:
Charts in brief: 3 Jun 10.

Charts in brief: 3 Jun 10.

Thursday, June 3, 2010


AIMS AMP Capital Industrial REIT: There is no doubt now that this counter has cleared a major resistance provided by a cluster of MAs. Closing at 22.5c today increased the probability of a retest of 23c, a long term resistance.  Would it stay range bound with 23c as the upper end of the range? The MACD is rising strongly and looks set to cross into positive territory which would signal the return of positive momentum. MFI is rising and OBV is rising.  The momentum seems strong.


FSL Trust:  Volume expanded nicely today on a white candle day.  The declining 20dMA is growing gentler in its gradient.  MACD continues to pull away upwards from the signal line in negative territory. MFI formed a higher low as it moves to test 50% again.  OBV is rising. The Bollinger bands are narrowing which suggests a reduction in volatility. 46c remains the resistance to watch for now. The declining 20dMA is at 47c.  Clearing these resistance levels could possibly see a target of 51.5c.


Golden Agriculture: Price touched a high of 52c after overcoming resistance at 50.5c. 52c, incidentally, is also where we find the declining 20dMA.  I have sold my remaining shares in this company at 51c. The negative divergence between rising price and falling volume is quite clear.  The downtrend is still intact and this rebound has provided me with an opportunity to divest.


SPH: Very nice white candle day but the volume has declined. Negative divergence.  Not so nice. MACD is poised for a bullish crossover in negative territory.  MFI has formed a higher low but OBV is flattish.  Closing at $3.79 is where we find the 20dMA.  Breaking this resistance, I believe, will find resistance at $3.83 next as this is where we find the 150% Fibo line as well as the 100dMA. Breaking this level would find resistance higher up at $3.88 and $3.90. Without an expansion in volume as price moves higher, I am doubtful that the higher resistance levels could be taken out and would therefore sell into strength.


Related posts:
FSL Trust: Time to buy?
AIMS AMP Capital Industrial REIT: A strong up day.
SPH: Flirting with the 200dMA.
Golden Agriculture: Downtrend is intact.

FSL Trust: Time to buy?

Tuesday, June 1, 2010

FSL Trust has moved above its most recent downtrend resistance on 27 May and has established an uptrend support since it bottomed at 42.5c on 21 May with a white spinning top.  That white spinning top has delivered as a reversal signal, it would seem.

The MACD has crossed above the the signal line in negative territory.  MFI has formed a higher high after being resisted at 50%.  OBV has stopped declining.  All the technicals suggest that downward pressure has eased and that its price might now be basing.


Should we buy some now? As a hedge, maybe. We have to bear in mind that price has been rising recently on very low volume.  If price starts declining again soon, we would have a lower high formed and we want to see that 42.5c is not tested again (in which case, it would form a higher low) or, if it is tested, it should hold up (in which case, it might form a double bottom).  If 42.5c breaks as support, a new lower low would be formed, which is bearish.  Then, the MACD's bullish crossover in negative territory would have just been signalling a rebound and not a more bullish reversal.

So, I might hedge with a smallish long position but I would only buy more if I see clearer signs that price has bottomed and that it is recovering.

Related posts:
FSL Trust: A sinking ship?
FSL Trust: That sinking feeling.

Charts in brief: 27 May 10 (Part 1).

Thursday, May 27, 2010

CLSA notes S-REITs offer yield of 7.1% vs yields of 5.3% from telcos, 3.0% from market.
 

“Unlike before, where S-REITs’ dividends could see further dilution from recapitalization exercises, we would argue that with a lower sector gearing and stable physical asset yields, most REITs would not need to recapitalise further. Hence, earnings and dividends are more insulated from any possible dilution,” says the research house.


Another up day for the STI on respectable volume. We will lose a trading day tomorrow as it is Vesak Day.  We can only cross our fingers and hope that global stock markets continue to strengthen tomorrow so that the STI could have a decent chance of continuing this rebound next Monday.

Courage Marine: This counter strengthened ever so slightly to close at 18.5c.  The BDI is up again at 4,209. The longer term support of 17.5c is holding as price formed a white hammer today on thin volume. I like this company's strong fundamentals. The technicals are turning up and I've bought some at 18c as a hedge.


MFI has formed higher lows and emerged from the oversold region. The MACD is turning up towards the signal line. Courage Marine might just be a laggard and might just play catch up if movement in the BDI remains favourable.

AIMS AMP Capital Industrial REIT: A rebound is underway. Volume expanded as MFI and BDI rose in tandem. The MACD has turned up towards the signal line since it started its decline ten sessions ago. Expecting strong resistance at 21.5c.  Overcoming 21.5c would give this counter a chance at retesting old highs at 23c.


CapitaMalls Asia: Volume expanded today as we have another white candle day. Price touched a high of $2.13 before retreating to $2.11.  The trendline resistance has done its job at $2.12.


MFI continues to rise, forming higher lows.  OBV is rising too.  MACD is rising in negative territory.  If the next session sees price closing above $2.12, we could see $2.19 tested as the next resistance. If this does not happen, price is likely to go lower, seeing that it is a symmetrical triangle and the downtrend could continue. I am no longer vested in this counter, having cut my losses in last week's rebound. Good luck to those who are still vested.

FSL Trust: Price has detached itself further from the lower limits of the Bollinger bands. It is quite obvious that OBV has stopped declining, suggesting that distribution activities have come to an end for now. MFI has formed a higher low and is still rising.  The MACD looks set to form a bullish crossover with the signal line, although it is still in negative territory.  The worst is probably over for this counter. For anyone who has been waiting to go long on this counter, it seems fairly safe to put in a hedge now although further volatility to the downside cannot be discounted.


Golden Agriculture: Reached a high of 52c only to close at 50.5c.  From the candlesticks, it would seem that 50.5c is an important resistance level.  Successfully overcoming this would find resistance at 52.5c and 54c.  Could it retest 56c, where we now find the flat 100dMA?


Related post:
Charts in brief: 26 May 2010.

Charts in brief: 26 May 2010.

Wednesday, May 26, 2010


Courage Marine: The BDI closed above 4,000 at 4,187.  That is up 6.188%.  Courage Marine, however, closed lower at 17.5c while Cosco, NOL and STX Pan Ocean rose. This, in my opinion, is an invitation to buy more shares of Courage Marine. 17.5c is a long term support and downside should be limited.  Another hedge, perhaps.


SPH: Formed a white hammer and recaptured the 200dMA at the same time.  This is a bullish reversal signal.  Resistance to be found at $3.82 to $3.84 which are price levels at which are found many times tested candlestick resistance and supports.  The 100dMA is also at $3.82 while the descending 20dMA is fast approximating $3.84. As the MACD is still descending in negative territory, this is likely to be just a rebound.


AIMS AMP Capital Industrial REIT: MACD is still drawing away downwards from the signal line as the histrogram turned green. MFI is still in oversold territory. 20c has been established as the new support. Any upward movement in price is likely to be capped by the gap resistance at 21.5c which is also where we find all the MAs bunching up.


LMIR: A gravestone doji suggests a failed attempt to move higher in price.  OBV turned up but the buying momentum is weak as suggested by a lower high on the MFI. Fundamentals are still good but I would wait and see due to the very weak technicals.


FSL Trust: A smaller white candle forming in the middle of a preceding larger black candle, we have a bullish harami setup.  If this setup is valid, price could continue higher to test 50c. The MACD is closing in on the signal line while the MFI is rising sharply. The technicals certainly suggest that the downward momentum is exhausted and a rebound is looking more likely.


CapitaMalls Asia: Nice white candle day. MFI formed a higher low. MACD averted a bearish crossover with the signal line. If price continues to move higher tomorrow, we would have a higher low.  Next resistance at $2.12 which was the support that failed on 4 May. This coincides with the trendline resistance. Going higher would find resistance at $2.19, an important support that held up in February. $2.19 is also where we find the descending 50dMA.


Saizen REIT: Another anxious seller.  This time at 3pm, 1.7m shares at 15c. FA is about value and TA is about price. So, the market could get quite irrational.  The next support, if 15c fails to hold up, is at 14.5c.  If the market is willing to sell to me cheap, I am willing to buy.  As of now, the 12 months uptrend is still intact.


Related post:
Charts in brief: 25 May 10.


Monthly Popular Blog Posts

All time ASSI most popular!


Bloggy Award