The email address in "Contact AK: Ads and more" above will vanish from November 2018.

PRIVACY POLICY

FAKE ASSI AK71 IN HWZ.

Featured blog.

1M50 CPF millionaire in 2021!

Ever since the CPFB introduced a colorful pie chart of our CPF savings a few years ago, I would look forward to mine every year like a teena...

Past blog posts now load week by week. The old style created a problem for some as the system would load 50 blog posts each time. Hope the new style is better. Search archives in box below.

Archives

"E-book" by AK

Second "e-book".

Another free "e-book".

4th free "e-book".

Pageviews since Dec'09

Financially free and Facebook free!

Recent Comments

ASSI's Guest bloggers

Showing posts with label NOL. Show all posts

CapitaMalls Asia and NOL: Increased exposure.

Tuesday, April 19, 2011

The STI retreated 19.01 points today to close at 3,125.37. Volume was rather low with only 1,075,913,210 shares worth a total of S$1,329,106,068 changing hands. Low volume on a down day is good news for bulls as it suggests a lack of conviction on the part of sellers. Today, I increased exposure to CapitaMalls Asia and NOL.

CapitaMalls Asia's trading volume reached its highest in 5 days and my buy queue at $1.80 was filled as price touched a low of $1.79. In my last blog post on this stock, I said I would accumulate on weakness but only on further weakness and not $1.83. $1.80 would be a hedge while I would accumulate further if price were to test $1.76.


Could $1.76 be tested in the next couple of days? Possibly since that would be also be a test of the 61.8% Fibo fan line. Momentum oscillators are all declining and could be testing 50% soon for support. Downside could be pretty limited from here. This counter has a compelling story to tell and the dual listing exercise once underway could provide it with some strong upward momentum. In the meantime, the descending 100dMA provides resistance and I could do a contra if price were to go that high in the next two days.

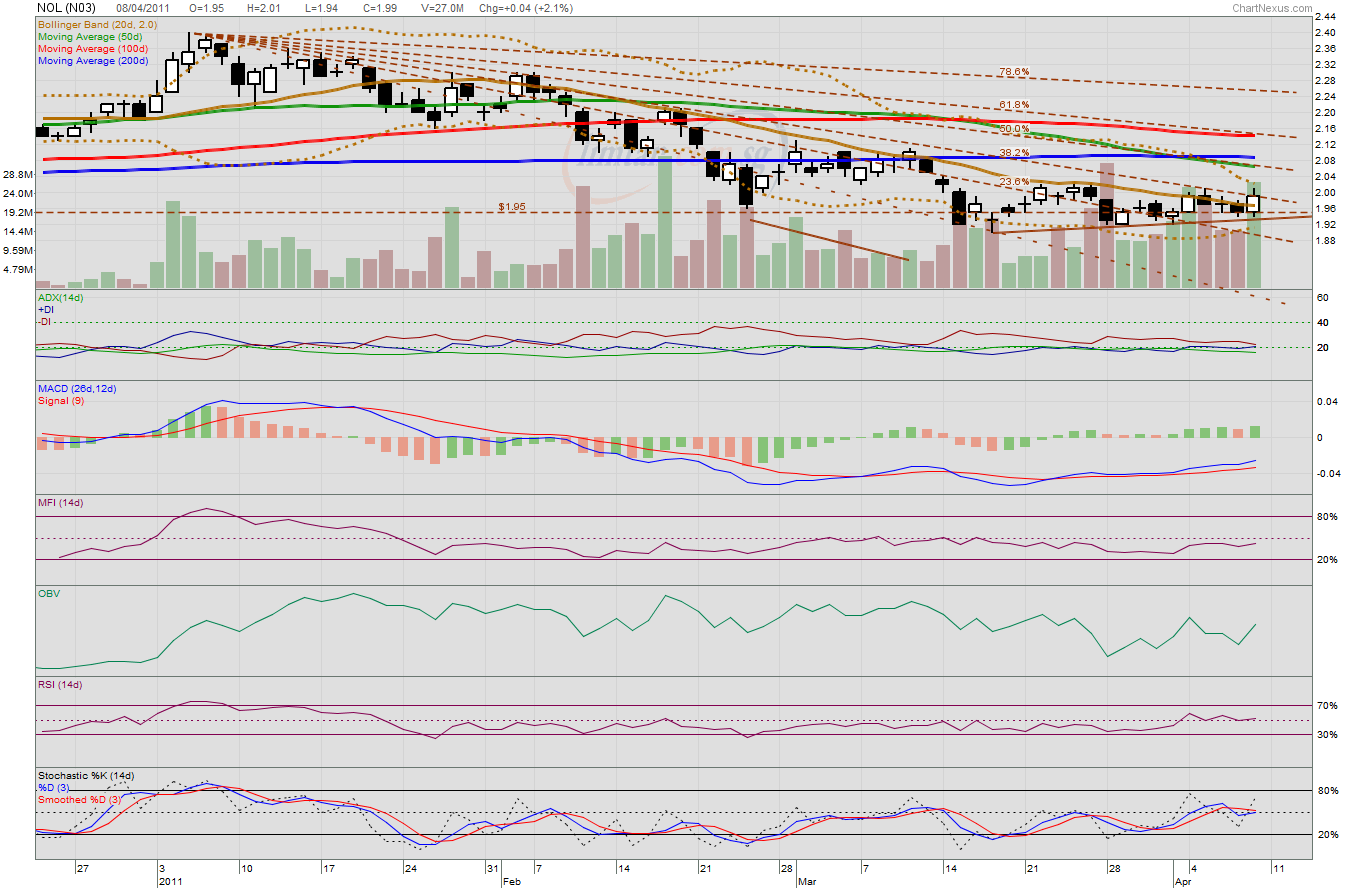
Earlier on, I had thought of NOL as forming a mild uptrending channel. That picture is now changed as a new low was formed today at $1.88. I bought more at $1.89 or 1 bid lower than the support of the range which I have identified as between $1.90 and $2.01. I like how a white spinning top was formed as price declined on reduced volume compared to the session before.


I also like how the MACD has a higher low even as price formed a lower low. Momentum is still encouraging and coupled with the white spinning top, we could have a rebound as the Stochastics seem to have declined into oversold territory too quickly. A retest of the 20dMA at $1.96? Perhaps so and that would be a nice price for a contra.

Related posts:
CapitaMalls Asia: Accumulate on further weakness.
NOL: Going higher?

NOL: Going higher?

Wednesday, April 13, 2011

Just yesterday, I initiated a long position in NOL at $1.95. Today, it closed at $2.01, forming a long white candle in the process. The fact that 1,918 lots were bought up at $2.01 after market closed is promising and we could see resistance at $2.01 broken tomorrow.


Further upward movement in price could see a gap close at $2.05 which coincides with the declining 50dMA. Going higher would see resistance at $2.09 (200dMA) and $2.13 (100dMA). All the momentum oscillators are midway of their own range and whichever direction the share price decides on moving, we could see some distance travelled before it becomes either overbought or oversold.

When would I divest? Well, if price continues to rise in the next couple of days, I could do a contra and keep the gains. Zero cost.


On the weekly chart, a strong resistance shows up at $2.07. This is provided by the declining 50wMA and 200wMA. Could we see $2.07 tested in the next couple of days or would the price sink to test support at $1.95 once more?

Related post:
NOL: Initiated long position at $1.95.

NOL: Initiated long position at $1.95.

Tuesday, April 12, 2011

My overnight buy queue for NOL at $1.95 was filled today.


NOL has emerged from a downtrend which started on 7 February but it is still within a downtrend which started on 5 January. It is currently moving sideways and we could possibly see some rangebound trading in the near future with $2.01 and $1.92 as the upper and lower limits. Would price move up or down from here? The Stochastics is currently flat at 50% and there is equal chance for upside and downside in the near term.


Any weakness which might lead to a test of support at $1.92 could see me increasing my stake in the company.  This is because the weekly chart shows a rising 100dMA, currently at $1.90. Only after 2 days into the week, it is easy to see that $1.95 seems to be an important pyschological support level for NOL's share price and, thus, I believe, buying in at $1.95 cannot be too far wrong.

Related post:
NOL: Out of the doldrums?

NOL: Out of the doldrums?

Friday, April 8, 2011

NOL formed a higher low on 28 March although it has yet to form a higher high. The impetus for this blog post is NOL's closing above the 20dMA for the first time since 10 March. Together with some other observations, it seems that NOL could be coming out of the doldrums.

Some might remark that NOL promptly sank on 11 March and what makes it different this time? Could not the price sink next Monday? Indeed, it could. This is especially so when we realise that price closed exactly at resistance provided by the 38.2% Fibo fan line.

However, I feel that things are looking up because, on the daily chart:


1. The MACD is higher now than it was on 10 March although it is still rising in negative territory.

2. There has been a prolonged period of low volatility which has resulted in tightening Bollinger bands.

3. As price moved higher lately, volume has not reduced dramatically like it did leading to 10 March.

On the weekly chart:


4. A white candle has formed on higher volume as a detachment from the lower Bollinger band takes place.

5. OBV shows a return of accumulation.

6. Stochastics suggests that the counter is oversold as it found itself trapped in sideways trading.

If there should be a pull back to $1.96 in the next session or two, I might initiate a long position. Near term upside targets are at $2.07 and $2.14 if the upward movement should continue.

NOL: That sinking feeling.

Monday, March 28, 2011

NOL is definitely not for the faint hearted. Today's black candlestick with price closing at $1.93 was formed on the back of very high volume and it looks like the downward momentum is strong as the MACD formed a lower high in negative territory. The MFI is also on its way to form a lower low.


Technically, NOL is still in a downtrend which started on 5 Jan 2011. A continuing downward movement in price could see the channel support at $1.84 tested or, in very bearish situation, the lower limits of the MA envelope tested. Any attempt to move higher would meet with resistance at $2.02, a recent thrice tested resistance level. Good luck to all vested.

NOL: Return to profit.

Wednesday, February 16, 2011

NOL reported a return to profit which beats analysts' estimates and declared a dividend of 4.6c per share!  Good news for shareholders, indeed!


Technically, the flat 200dMA is providing support and we could see price going higher tomorrow. I expect initial resistance at $2.18 which is where we find the rising 100dMA. Stronger resistance is expected at $2.23 which is where we find the 50dMA and it is also where a dead cross was formed by the declining 20dMA and the 50dMA.

Expect some selling into strength to take place as the MFI has been forming lower highs. This suggests a dampening of demand. Watch those resistance levels. If they should be taken out on the back of high volume, then, price could go higher. $2.30 would be next.


Related post:
NOL: Full steam ahead.

NOL: Full steam ahead.

Wednesday, January 5, 2011

NOL tested its high of $2.35 touched in April 2010. The difference is that in April, it was a black candle and in the last session, it was a white candle. I like what I see in the OBV. It has been placid since early November 2010 as price went on to form two dips. No visible distribution. The weaker holders were being shaken out.


Taking the lows of $2.02 and $2.12, using $2.24 as the neckline gives me two targets at $2.36 and $2.46. $2.35 is only 1c shy of $2.36. I expect $2.46 to be attainable if volume continues to expand on upmoves. Having said this, price climbs a wall of worries and the MFI and RSI are bordering on overbought. It would make sense to divest partially and take some profit at resistance. Good luck to all NOL shareholders.

NOL: Multi-month uptrend.

Saturday, November 6, 2010

On 1 Nov, I suggested that "Taking in the Fibo lines, we could see 138.2%, which coincides with the high of 15 April, retested.  This is at $2.35. This, of course, is based on the assumption that the current bullish momentum follows through."


On 3 Nov, the counter hit a high of $2.32 before closing at $2.30. So, the closing price was just 5c shy of the 138.2% Fibo line. Volume expanded significantly, providing the fuel which created an impressive white candle. With the MACD rising strongly above the signal line in positive territory and the MFI yet to break into overbought territory, it looked as if it would retest resistance at $2.35.


On 4 Nov, price action formed a hangman (a black hammer at a peak) which suggested the presence of selling pressure. However, the relatively low volume suggested that the selling pressure was weak. Indeed the OBV confirms a lack of distribution. With MFI and RSI both in overbought territory, this counter could face some short term resistance in moving up further in price. A pullback to $2.16 would be a good price to accumulate if we believe in the multi-month uptrend.


Related post:
NOL: $2.21 and moving higher?

NOL: $2.21 and moving higher?

Monday, November 1, 2010

NOL's share price pushed higher today, forming a nice white candle, to close at $2.21, just 2c shy of the intra day high at $2.23. Volume expanded nicely as well.


All technical indicators show that the uptrend has positive momentum: MFI has formed higher lows suggesting a sustained demand and this is reinforced by the OBV which shows consistent accumulation. Every single pullback in NOL's share price in the past few months was an opportunity to accumulate, it would seem.

Taking in the Fibo lines, we could see 138.2%, which coincides with the high of 15 April, retested.  This is at $2.35. This, of course, is based on the assumption that the current bullish momentum follows through. With the MFI poised to enter overbought territory, taking some profits off the table in such a situation is not a bad idea although in extremely bullish conditions, the MFI could stay overbought for a long while.

NOL: Breakout.

Thursday, July 29, 2010

NOL rose to close at its high of the day at $2.08 on significantly higher volume.  With this, it has broken out of the symmetrical triangle observed some time back.  OBV has been somewhat choppy but rising further would indicate increased accumulation.  MFI has formed an uptrend recently and this suggests increased demand. 


The next resistance is at $2.13, the high of 21 Jun which also did a gap fill then. This is a price which market participants are likely to remember. Taking this out convincingly would give an intial target of $2.28 as suggested by the 138.2% Fibo line.


Charts in brief: 16 Jul 10 (Part 3).

Sunday, July 18, 2010

LMIR: Although falling to 48.5c today means that price has fallen below the downtrend resistance drawn from the high of 11 Jan, price has been falling on lowering volume in the last few sessions.  This is comforting as it means a lack of distribution. This is confirmed by the OBV. 48.5c is resistance turned support for now.


NOL: $2 is an important resistance turned support formed by the merged 20d and 100d MAs. If this were to break, price could fall to $1.94 next. What looks like a symmetrical triangle has formed. Breaking to the downside would find initial support at $1.84, the 23.6% Fibo line which coincides with the 200dMA. Breaking to the upside gives an initial target of $2.22.


Raffles Education: Since hitting a high of 34c on 12 July, there has clearly been distribution activity as suggested by the declining OBV. Price is now supported by the 20dMA at 29.5c. The decline in price in the last few sessions has been accompanied by declining volume and this low volume pullback could be a chance for some brave punters. The MFI is still uptrending and if it were to bounce off its support, price could move higher once more.


SPH: OBV rising strongly, suggesting heavy accumulation. MFI bordering on overbought. MACD rising strongly in positive territory. All these as price closed at $4.08, the target I identified not too long ago. Volume is lower which suggests that price moved higher because there were lesser sellers.  People are probably waiting to see how high it can go.


Related posts:
SPH: BUY calls aplenty.
LMIR: Recovering for real?
Raffles Education: A spectacular white candle.
NOL: Downtrend.

Charts in brief: 9 Jul 10.

Friday, July 9, 2010

NOL: This counter touched a high of $2.07 which is the initial resistance identified earlier. Volume is much lower today as it closed at $2.06, 5c higher than the previous session. The MACD has crossed the signal line and returned to positive territory at the same time. OBV continues to climb, suggesting further accumulation is taking place.


What has formed could be a symmetrical triangle. With the negative divergence between price and volume largely corrected, we could see a breakout in the next session which could eventually see price testing the high of $2.35 touched on 15 April.  Before that happens, expect multiple resistance along the way.  In case price fails to move higher, immediate support is at $2.00.

Genting SP: Continues to be resisted at $1.20. Volume is declining. MFI which accounts for price and volume is declining and forming lower highs.  Demand is falling.  OBV is tired looking. The Bollinger bands seem to be in the early stage of narrowing.  Could the price move higher? With the 20dMA still rising, the shorter term uptrend is intact. It remains to be seen if the 20dMA could push the price higher. This is not for the faint hearted.


Related post:
Charts in brief: 8 Jul 10.

Charts in brief: 8 Jul 10.

Thursday, July 8, 2010

CapitaMalls Asia:  Is this counter just rebounding from oversold levels or is this the beginning of an uptrend? The recent low of 6 Jul at $2.02 helped to establish the third fan line.  This is a gentler uptrend compared to the earlier two fan lines.  All three fan lines originate from the same low of $1.91 achieved on 7 May. Distribution reached a peak on 2 Jul as volume expanded on two consecutive black candle days. The lower volume on the two black candle days compared to higher volume on up days after that suggests that we have reached a floor and price is turning up. Volume expanded today as price moved higher to close at $2.07.  Forming a doji, however, suggests that the buying lacks conviction. Immediate resistance at $2.10 and if momentum stays positive, we might see $2.13 tested too.


Golden Agriculture: Negative divergence between price and volume is quite obvious to me. Today's white candle has closed above the downtrend resistance. However, this was achieved on much lower volume. Is this sustainable? Theoretically, no. Next resistance at 55c. CPO continues its downtrend and is at RM2,290 today. The double top achieved earlier this year at about RM2,700 could see price of CPO correcting to about RM2,100 in time.  This is not good for Golden Agriculture's bottom line.


Genting SP: Continuing its levitation act despite an obvious negative divergence between price and volume. MFI, which accounts for price and volume, is in a downtrend.  Demand has fallen but price remains quite bouyant. Unless volume expands significantly and the resistance at $1.20 is taken out convincingly soon, this is a sign of churning and perilous for anyone who chooses to go long now. A retracement would find initial support at $1.12.


NOL: Volume expanded tremendously as price gapped up and formed an impressive white candle. Breaking resistance formed by a confluence of MAs is likely to see price moving higher.  I see initial resistance provided by the downtrend resistance at $2.07 in the next session.


LMIR: Technically, I still see a negative divergence between price and the MFI. The doji formed today could even be the set up of an evening star pattern. Having said this, if the uptrend support holds up if next tested, it could be a sign of firm underlying support and the rising OBV since price touched a low of 42c on 25 May does suggest that there is more accumulation than distribution going on.


Charts in brief: 5 Jul 10.

Monday, July 5, 2010

NOL: MFI did not manage to recapture 50% as support and its continuing decline suggests a lack of demand.  RSI similarly did not manage to recapture 50% as support and this suggests the speed of decline in price is relentless. Downtrend in price is intact. Since forming an inverted hammer on 21 Jun, volume has increased as price declined.  In the last two sessions, trading volume has fallen somewhat. This might or might not be a temporary respite.  I see support at the flat 200dMA, $1.83, and resistance at a confluence of MAs, $1.98.


SPH: Price touched a high of $3.88 again. MFI is rising sharply.  Demand is strong.  OBV is rising.  Accumulation is ongoing. Volume is, however, a tad lower today.  Breaking $3.88 could possibly see a target at $4.08 reached. Resistance at $3.95, the lower high formed on 10 May, would have to be taken out first, in such a case.


Metro: This counter has been in a downtrend since it peaked on 7 Jan, touching a high of 90.5c. Since May, indicators are showing some strength returning.  MFI has been climbing since late May.  OBV has been rising since late May.  RSI has been rising since early May.  The peak in distribution happened on 25 May as an ugly black candle was accompanied by a huge spike in trading volume.  A low of 73.5c was touched in two separate sessions on 21 May and 7 Jun.  That likely is the immediate support for now.  With momentum oscillators bouyant, it is unlikely that 73.5c would be taken out anytime soon.  In fact, the 20dMA has been rising gently since middle of June. The trend is still down but the worst might just be over, for now.


Related posts:
NOL: Downtrend.
Charts in brief: 2 Jul 10.

NOL: Downtrend.

Thursday, July 1, 2010

After hitting a high of $2.35 on 15 April, NOL was in a downtrend which was broken on 16 Jun on relatively high volume. Price hit a high of $2.13 on 21 Jun while forming an inverted white hammer, a reversal signal. This reversal signal was promptly confirmed in the next session. Forming a high of $2.13 on 21 Jun created a bearish picture because it was a lower high compared to the high of 13 May at $2.18.  This was a warning sign.


The MACD histogram turned red on 22 Jun while the RSI and OBV turned down the same day. Price has broken through various supports since then.  Price is currently resisted by the merged 20d and 100d MAs at $1.97.  With the 50dMA declining just above these merged MAs, it would be a difficult resistance to overcome without a buy up on massive volume.  Any upside could be resisted by the 50dMA just a few cents higher at $2.00. It seems that there are more sellers too if we notice how volume has increased as price declined since 21 Jun.  This is confirmed by the lower highs on the OBV which suggests that distribution activity has increased.

The MACD has formed a bearish crossover with the signal line and a retest of the flattening 200dMA which is currently at $1.83 seems likely.  As a support, the 200dMA was breached on three consecutive days in late May. So, this makes it somewhat unreliable and it is, therefore, a very important support to watch now.  If it manages to hold up, we would have a higher low formed.  A symmetrical triangle could then be in the works.  If the 200dMA support breaks, we could see the previous low of $1.75 tested.

Given the bearish technicals, I would sell at resistance at $1.97 if I have the chance to do so. If luck is on my side, I might even be able to sell at $2.00 on a possible whipsaw. Prices do not go down in a straight line and there could be little bumps up along the way.  So, a retest of the 100dMA as resistance again is possible. Of course, it might not be at $1.97 then. We want to sell at resistance and buy at supports.  Use the prevailing trend as a guide. Good luck.

Charts in brief: 22 Jun 10.

Tuesday, June 22, 2010

NOL: Sell signal seen on the MACD histogram. So, will the price fall for sure? I cannot say but the negative divergence between price and volume has to be resolved.  There should be a pretty strong support at $1.95, a many times tested resistance of a mini ascending triangle pattern. $1.95 is also where we find the rising 100dMA at the moment.


AIMS AMP Capital Industrial REIT: OBV shows steady accumulation. MFI has formed a lower high in the very short term. MACD has crossed into positive territory. If the MFI could gradually fall while the price remains at or above the 21.5c support, it would be good news for bulls.


CapitaMalls Asia: A black spinning top and a bearish harami to boot. A possible pullback to $2.13 where we find the trendline support and the 50dMA is not hard to imagine. Rising positive buying momentum as suggested by a rising MFI should limit any selling pressure.


Courage Marine:  MFI and OBV continue to rise sharply as volume almost tripled on a day that saw price hit a high of 21c.  21c was identified earlier as a strong resistance and it could not be taken out today.


Charts in brief: 8 Jun 10.

Tuesday, June 8, 2010

Golden Agriculture: Price tried to move higher today, only to close unchanged, forming a gravestone doji in the process. MFI has formed a higher low.  OBV is flat.  The MACD has risen above the signal line in negative territory.  Selling pressure has abated but it is obvious that the counter has broken its longer term uptrend as it has been trading below the 200dMA for many sessions now, unable to recapture support. The 20dMA is also poised to form a dead cross with the 200dMA. Further downside should find support at 44.5c as shown by Fibo lines.  This happens to be a gap support formed on 9 Nov 09 as well.  Immediate resistance is provided by the 200dMA at 51c and this coincides with the 78.6% Fibo line.


Healthway Medical:  News that Peter Lim became a substantial shareholder of Healthway Medical has given the share price a lift. Volume expanded today as price touched a high of 17.5c before closing at 17c. MFI is now testing 50% while OBV has risen. MACD continues to rise above the signal line in positive territory. There is no doubt that this counter is seeing a trend reversal. Continuing rise in price would find resistance at 18.5c.  Breaking 18.5c would suggest that we have seen a double bottom formation and would establish 13.5c as a very important support in future.  If 18.5c fails to be taken out, we might see a triple top formation.  In the meantime, congratulations to all who are still vested and do keep an eye out for any negative divergences.


AIMS AMP Capital Industrial REIT: A gravestone doji formed today as price closed at 21.5c. MACD has completed its turn downwards towards zero. OBV continues to decline suggesting distribution is taking place although a rising MFI suggests that positive buying momentum is still present.  I would accumulate on weakness.


CapitaMalls Asia:  Sell signal on the MACD histogram was confirmed today. MFI has been forming lower highs as volume shrank. The rebound in price has weakening technicals. I am inclined to believe that the symmetrical triangle would resolve itself on the downside.


NOL: Declining 20dMA is set to form a dead cross with the flat 100dMA.  Price has not been able to overcome resistance provided by the 100dMA on three recent occasions with the latest attempt three sessions ago looking tired. MFI formed a lower high after testing 50% as resistance a few sessions ago.  Since touching a low together with a low in price on 25 May, the OBV has been rising which suggests accumulation activity. This may well limit the downside for this counter.


Charts in brief: 27 May 10 (Part 2).

Thursday, May 27, 2010

Healthway Medical: The MACD is poised for a bullish crossover with the signal line in negative territory. MFI is just above the oversold region while OBV has been in gradual decline.  Technically, not very inspiring although the 14c support has been recaptured.  This is a long term support provided by the 200dMA which has flattened.


The shorter term downtrend is obvious with both the 20d and 50d MAs declining. Overcoming the 20dMA resistance would probably see 15.5c tested as a significant resistance level.  Another chance to sell at resistance? Perhaps. Good luck to all who are still vested.

LMIR: An impressive white candle day. MFI formed a higher low and is rising.  OBV is rising. MACD has turned up towards the signal line.Without higher volume on an up day, we have to remain somewhat sceptical of the upmove but an upday is always welcomed. I would now wait to see if the upward movement continues. I expect resistance to any continuing upward movement in price at 47c which was the support level which failed on 19 May. This was rather recent and is still fresh in the minds of market participants.


NOL: Buying momentum has been improving with the MFI rising.  OBV has been rising strongly too, suggesting accumulation is robust. A white engulfing candle formed today after a black spinning top yesterday. This confirmed the black spinning top as a reversal signal.  Expect further resistance at $1.94 and $1.99.


Saizen REIT: It is quite obvious that there is some weakness in the short term.  If the tension in the Korean peninsula should escalate, more nervous investors might sell their investments in Saizen REIT. This, unfortunately, is not something we could have anticipated or controlled.  Fundamentally, Saizen REIT is improving over time and its income stream is stable and secure. 15.5c remains a significant support.  The next significant support is at 14.5c.


SPH: Things are turning around, it seems.  A white candle day with MFI and OBV rising. MACD has gone flat which allows the distance with the signal line to lessen. Immediate support provided by the 200dMA at $3.70 while immediate resistance is at $3.78.  Overcoming $3.78 would find further resistance at $3.82 where the fast descending 20dMA seems poised to form a dead cross with the 100dMA in the coming sessions.


Starhub: Price has not been able to recapture the 200dMA support so far. $2.14 remains the immediate resistance. Although MFI has been rising, forming higher lows, OBV has not been as enthusiastic.  This suggests that we have positive buying momentum but accumulation is weak. MACD is still declining in negative territory and the downtrend is still very much intact.


A successful break above the 200dMA would find resistance at $2.19, the top of a base formation which lasted a few months.  Upside seems limited and going long at this point seems less likely to be rewarding. Any decline in price from here should see initial support at $2.06, the neckline of a reverse head and shoulders formation seen in November 09.

"We could have had an interim bottom of some kind - had an incredibly negative spate with really big volume on the downside," says Danielle Park, president of Venable Park Investment Council and author of Juggling Dynamite. "I think the themes we're concerned about today are like the volcanic cloud over Europe. It'll blow away for a little while and then it'll come back." 
Posted May 26, 2010 05:09pm EDT by Aaron Task


Related post:
Charts in brief: 26 May 2010.

Charts in brief: 20 April 10.

Tuesday, April 20, 2010

The STI clawed back 20.44 points today to close at 2,981.31 on respectably high volume. U.S. Futures are all showing an upward bias as of now.  This bull has legs.

Despite guarded sentiment, Phillip Securities says longer-term outlook for market still positive: “The reaction to Goldman’s fraud charges could eventually be trumped by what has been very positive S&P 500 earnings results.” Written by The Edge, Tuesday, 20 April 2010 13:30.

CapitaMalls Asia: Another black candle day as price closed at the support identified at $2.20.  My overnight buy queue was done.  Will the counter retest the low of $2.19 made in February this year or would price bottom here and start a basing process to form a double bottom?  Only time will tell.  Stochastics is suggesting that the counter is very oversold and further downside should see the next significant support at $2.12.


Golden Agriculture: Another doji as price stays above the rising 20dMA.  Volume has reduced. All MAs are trending upwards. From the MFI, it is obvious that positive buying momentum is lacking. Hard to say which way this might go.  So, no fresh positions for now.  Would buy some if price retraces to 56.5c.

China Hongxing: Closing at 15.5c, it formed a gravestone doji as price touched a high of 16c today.  Although it is a gravestone doji, I think it more positive than negative here as price did not touch 15c the whole day.  This means that, for the first time since 26 January, China Hongxing managed to trade at or above the 50dMA the whole day. The MACD continues to rise and seems to be sneaking a peek above zero, heralding a return of positive momentum. However, volume is anaemic and this will have to expand for a convincing move up.


Courage Marine: Low volume day as MFI and OBV both turned up slightly. Not much to say here. I would accumulate on pullbacks. Overcoming the gap resistance at 23.5c should test the immediate target of 25.5c.  Eventual target is still 27c.

Saizen REIT: Someone sold down 3m warrants and 1m shares at 7.5c and 16.5c respectively, rather late in the day.  This caused the OBV and MFI to both turn down.  16.5c is now the new floor for Saizen REIT.  This is a support level provided by the 50dMA.  My overnight buy queue for more warrants at 7.5c was filled.


Healthway Medical: 16c is still holding up nicely as the support.  OBV is flat.  No obvious distribution.  MFI is declining gently, which is logical. This counter might just be basing at 16c for a while. Further downside will find support at 15c.

NOL: Formed a higher low yesterday as it closed at $2.24 today, forming a wickless white candle.  Nice.  Uptrending OBV suggests continuing accumulation. Taking out the recent high of $2.35 would suggest an immediate target of $2.50.  Eventual target is still $2.60.  A rising 20dMA and candlestick supports should limit downside in the near term to $2.11 but a stronger support is found at $1.96.

Goldman Sachs reported first-quarter earnings of $3.3 billion, or $5.59 a share, on revenue of $12.78 billion. Earnings nearly doubled from a year ago and the results were well ahead of consensus expectations. Posted Apr 19, 2010 05:16pm EDT by Aaron Task.


Related post:
Charts in brief: 19 April 10.

Charts in brief: 15 April 10.

Thursday, April 15, 2010

Another high volume day for the STI.  The index closed hardly changed today.  Unless there are more definite signs to the contrary, the bias is for the index to continue rising.


CapitaMalls Asia: Turning in a set of impressive numbers has not helped its share price as it closed at $2.27 today.  A big black candle day on higher volume.  Fundamentally, this company is very sound.  Technically, it has been rather weak.  It has been consolidating since breaking down from an uptrend on 23 March.  If downward pressure persists, I see strong support at $2.20 and that's where I would buy more. Upside eventual target remains at $2.55 which is a few cents more than DBS Vickers' target price of $2.51.


Golden Agriculture: Mixed signals persist as a white inverted hammer was formed today with price closing the session at 61.5c.  Could we be looking at a correction using time?  Could Golden Agriculture's price be waiting for the 20dMA to catch up?  We have had a series of reversal signals but none has been confirmed as price closed firmly at or above 60c, the immediate support, in the last few sessions.  MFI has formed a higher high after forming higher lows.  Buying momentum is positive. OBV has not declined dramatically. The situation is very dicey.  Wait and see.  No fresh positions and I will hold on to my remaining shares in case the price goes higher.


NOL: Price did not close above $2.30 today and the buy signal on the MACD has been negated.  Volume is much reduced compared to the previous session.  This suggests that this is profit taking rather than a massive selldown.  Further downside should be capped at $2.17, a many times tested resistance turned support.  This is followed by $2.12.  A continuing trek upwards would need to see the price closing above $2.30 firmly and the eventual target is $2.60 then.


Courage Marine: Clinging on to 22.5c, the MFI remains in overbought territory.  I would accumulate on weakness and queue to buy more at 21.5c (one bid above initial support).  Courage Marine's strong fundamentals and the improving Asian economies bode well for the company's fortunes in the near term.

SPH: A very nice white candle day on heavy volume as the price closed firmly above $4.00 at $4.04.  The upside target is now $4.20.  OBV is rising strongly, signalling increased accumulation and the MFI has pushed further into overbought territory. Any pullback would see $3.84 acting as a strong support.

AusGroup:  Sell signal seen on the MACD.   MFI in overbought territory.  A pullback should find support at 63.5c.  70c is the immediate target.


Related post:
Charts in brief: 14 April 10.


Monthly Popular Blog Posts

All time ASSI most popular!


Bloggy Award