The email address in "Contact AK: Ads and more" above will vanish from November 2018.

PRIVACY POLICY

FAKE ASSI AK71 IN HWZ.

Featured blog.

1M50 CPF millionaire in 2021!

Ever since the CPFB introduced a colorful pie chart of our CPF savings a few years ago, I would look forward to mine every year like a teena...

Past blog posts now load week by week. The old style created a problem for some as the system would load 50 blog posts each time. Hope the new style is better. Search archives in box below.

Archives

"E-book" by AK

Second "e-book".

Another free "e-book".

4th free "e-book".

Pageviews since Dec'09

Financially free and Facebook free!

Recent Comments

ASSI's Guest bloggers

Showing posts with label genting. Show all posts

Charts in brief: 13 Aug 10 (Part 1).

Friday, August 13, 2010

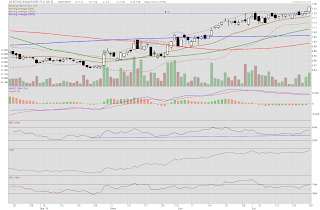
Genting SP: Broke resistance, gapped up and formed a wickless white candle on extremely high volume.  Closing at $1.46, could it go higher next week?  With such strong momentum and a flurry of BUY calls from all the research houses, we could see price going higher.  To any investor who ignored the constant SELL calls from these houses earlier, congratulations!


China Hongxing: MFI has been declining gently, no longer in overbought territory.  OBV rose today, sign of a return of accumulation activity. Volume expanded significantly as price rose today.  This is promising. Closing at 15.5c shows that the declining 200dMA is still acting as resistance. Could the rising 20dMA push the price beyond the 200dMA? Immediate support at 14.5c and immediate resistance at 16c.


Hock Lian Seng: OBV shows a trend of consistent accumulation since 21 July.  This company has strong fundamentals and, technically, the immediate support is at 28.5c, provided by the 100dMA. The rising 20dMA is on track to form a golden cross with the 100dMA soon.  This would probably strengthen the support at 28.5c. Price seems to be forming steps upwards and this reminds me of HWT's chart once upon a time.  The recent uptrend is defined by the rising 20dMA.  Could the 20dMA push price higher? Possibly. Bugbear is the falling volume.


Genting SP: Uptrend intact.

Thursday, August 12, 2010

Genting SP's uptrend is clearly intact.  The 20dMA is still rising. Could it push price higher?


The MFI is declining towards 50%.  Could 50% provide support? OBV shows a lack of distribution activity. So, despite a weakening demand, there is no serious selling down.

Immediate support is at $1.25 and immediate resistance is at $1.30.


Genting SP: Bearish engulfing candle.

Tuesday, August 3, 2010

Genting SP spots a bearish engulfing candle today.  This is a big black candle that envelopes the entire candle of the previous day.  This is extremely bearish as it indicates that price started the day higher but met with resistance and turned down to close lower than the previous day's low. That this was accompanied by high volume makes it more ominous. The bearish situation is backed up by a sell signal on the MACD histogram and the MACD has turned down towards the signal line.


However, even with the massive sell down today, the uptrend is still intact.  Look at the support line I labelled "uptrend support 2".  This uptrend approximates the position of the 20dMA.  Could price bounce off this support in the next session or continue to decline to test the many times tested resistance turned support at $1.20?  Although the MFI has turned down, the uptrend is intact.  OBV has turned down which indicates some distribution took place today.


Genting SP: Inverted white hammer.

Thursday, July 29, 2010

Price touched a high of $1.29 before closing at $1.27, forming an inverted white hammer in the process.  This suggests some weakness: the upmove lacks conviction.  The unimpressive volume confirms this observation.


Although the OBV is still rising, suggesting continuing accumulation, there is some profit taking going on and a stalling demand.  This stall in demand is confirmed by a flat MFI which is bordering on overbought.

Many are expecting Genting SP to report a set of sterling numbers but till then, could we see price softening somewhat to retest support provided by the rising 20dMA? There is a chance and that might be an opportunity for any bulls on Genting SP to accumulate.


Genting SP: Doji.

Wednesday, July 28, 2010

Genting SP formed a doji today, a sign of indecision. Volume shrank today which is a sign that most people are staying sidelined. This stalemate is confirmed by the OBV which has gone flat. The MFI which has been rising and bordered on overbought has declined slightly.


Genting SP might just be taking a breather although with MFI almost overbought and RSI high in overbought territory, one wonders if it is ripe for a correction. Any pull back should see initial support at $1.20, a many times tested resistance level before and should be a strong support.  This, incidentally, is also where we would find the rising 20dMA in the next session.


Charts in brief: 26 Jul 10.

Monday, July 26, 2010

Genting SP: Volume expanded today as price closed at $1.24.  The MACD seems poised to do a bullish crossover with the signal line. Momentum is looking good and one wonders if $1.20 is now resistance turned support. Needs confirmation. However, if one looks at going above $1.20 as a breakout, this is a very "quiet" breakout with rather modest volume. Is it durable?


CapitaMalls Asia:  Downtrend intact with today's black candle. OBV has formed a lower high, suggesting ongoing distribution activity. The descending 20dMA is preventing further gains. We could be seeing the beginnings of a descending triangle pattern if the downward pressure continues. Immediate resistance at $2.06 and immediate support at $2.02.


FSL Trust: Results were announced today with 2Q FY10 DPU at US0.95¢.  Volume rose today and there was much selling down of its units.  In spite of this, price remained unchanged at 42c.  This is a sign of strength as it means staying above the 50dMA.  MFI continues to rise, suggesting increased demand.  OBV is rising, suggesting continuing accumulation. There is some underlying support for this counter.  20dMA continues to rise and we might be in for a golden cross with the 50dMA soon.


SPH: The MFI has broken its uptrend support, suggesting a weakening demand. This coupled with the MACD set to do a bearish crossover with the signal line, a retracement to the 20dMA cannot be ruled out.  This is currently at $3.95 which is also an important candlestick resistance turned support. Volume has been reducing as price pulled back.  This is good news for bulls.  Support at $4.00 seems shaky and if this goes, I would keep an eye on $3.95 to see if it holds up as the next support.


Charts in brief: 23 Jul 10.

Sunday, July 25, 2010

AIMS AMP Capital Industrial REIT: I was at a friend's house warming and we talked about the stock market a bit and his broker said that this REIT has a very low market capitalisation.  So, it was not on his radar screen.  Actually, I like the sound of that because it would give me more time to accumulate at lower prices.  However, with recent increased accumulation activity as suggested by the OBV's direction, I suspect more are taking note of this REIT's high yield, large discount to NAV and relatively low gearing.  Looking at the candlesticks, it seems that a new support level has been established at 22c in the near term.  Is this sustainable? With all the MAs rising, it might be. The MFI broke out of its downtrend decisively four sessions ago which signals a return of demand. Any further upmove in price would see a retest of the resistance at 23c.


Genting SP: Price has finally closed above $1.20 in the last session.  At $1.21, could it go higher? From 21 June, when price first touched a high of $1.21, volume has been shrinking as intraday price range became narrower and narrower. Volume is the fuel that drives rallies.  Without any expansion in volume in a move up in price, bulls do have cause to worry. It is encouraging that the MFI has moved out of resistance and this shows a return of demand.  However, OBV is flattish which suggests that there is a stalemate between accumulation and distribution despite a return of demand.  Things still look dicey and I would keep an eye on the support provided by the 20dMA which is currently at $1.18.


Charts in brief: 16 Jul 10 (Part 2).

Saturday, July 17, 2010

FSL Trust: 42c seems like a difficult resistance to overcome at this point in time. This is gap resistance and resistance provided by the declining 50dMA at the same time. RSI has also moved higher up into the overbought region while we see a sell signal on the MACD histogram.  Volume has been reducing as price moved higher. Without an expansion in volume as price moves higher, it is unlikely that 42c could be taken out in the next session. Unless there is some positive newsflow soon, chances of a pullback in price are higher. With all the higher lows formed in the MFI and RSI, the momentum oscillators are clearly uptrending and I expect any pullback to find initial support at 40c.


Genting SP: First touched on 29 Jun, $1.20 has proven to be a tough nut to crack. Volume has been reducing since that day as price stayed above the 20dMA. If we look purely at the 20dMA, the short term uptrend seems to be intact. However, if we look at the MACD, we see a bearish crossover with the signal line on 2 Jul and since then the MACD has been declining beneath the signal line. MFI, RSI and OBV have all flatlined.  There is clearly no trend where these indicators are concerned.  Pay attention to the 20dMA which should be at $1.17 in the next session or so.  If this is breached, price could move lower rapidly.


Healthway Medical: Since price touched a high of 21c on 16 Jun, the MFI has been in decline.  This suggests a weakening demand. However, we do not see a similar decline in the OBV.  In fact, the OBV has gone up which suggests that there is more accumulation than distribution. There is some underlying support and even though demand has weakened, there is little selling pressure.  Immediate support is at 18.5c.


K-REIT: A very nice up day with a very nice white candle as volume more than doubled from the previous session.  Price closed at $1.22, the high of 11 and 12 Jan.  if momentum keeps up and price action goes parabolic, I won't be surprised if we see $1.34 (161.8% Fibo line). At this point in time, it is still a fantasy.


Related posts:
FSL Trust: The skies are clearing up.

Charts in brief: 9 Jul 10.

Friday, July 9, 2010

NOL: This counter touched a high of $2.07 which is the initial resistance identified earlier. Volume is much lower today as it closed at $2.06, 5c higher than the previous session. The MACD has crossed the signal line and returned to positive territory at the same time. OBV continues to climb, suggesting further accumulation is taking place.


What has formed could be a symmetrical triangle. With the negative divergence between price and volume largely corrected, we could see a breakout in the next session which could eventually see price testing the high of $2.35 touched on 15 April.  Before that happens, expect multiple resistance along the way.  In case price fails to move higher, immediate support is at $2.00.

Genting SP: Continues to be resisted at $1.20. Volume is declining. MFI which accounts for price and volume is declining and forming lower highs.  Demand is falling.  OBV is tired looking. The Bollinger bands seem to be in the early stage of narrowing.  Could the price move higher? With the 20dMA still rising, the shorter term uptrend is intact. It remains to be seen if the 20dMA could push the price higher. This is not for the faint hearted.


Related post:
Charts in brief: 8 Jul 10.

Charts in brief: 29 Jun 10.

Tuesday, June 29, 2010

CapitaMalls Asia: $2.14 looks like it is support turned resistance. We will need confirmation tomorrow. Price touched a low of $2.07 (the 138.2% Fibo line) before closing at $2.11, just 1c shy of the 50dMA at $2.12. The MACD has completed a bearish crossover with the signal line while the MFI continues to decline. There is a lack of demand at the moment and OBV suggests that distribution is ongoing.  It is also clear that as price fell from $2.22 five sessions ago, volume has expanded.  Immediate resistance is at $2.14 and immediate support is at $2.07.


Golden Agriculture: Formed an ugly black candle that is almost engulfing. Closing exactly on the 52c support after touching a low of 51.5c suggests that we might see continuing weakness, especially with momentum oscillators downtrending.  The MACD is about to form a bearish crossover. Next support remains at 50c.


Genting SP: It has been a while since I did a TA for this counter but Citibank says that this is one of their biggest SELL recommendations right now. That got me curious enough to look at the charts. For more than a week, this counter has been generating reversal signals: dojis and spinning tops. Today, volume expanded tremendously as price touched a high of $1.20 before closing at $1.15, forming a black candle.  MACD is about to form a bearish crossover. The RSI is at 87% and suggests that the rate of increase in its price has been too rapid.  MFI, on the other hand, is not in overbought territory yet and is still uptrending. OBV is flat which suggests that any selling is well absorbed. At the moment, the uptrend is still intact and immediate support is at $1.12 as suggested by candlesticks and the uptrend support line.


LMIR: Another lower high on the RSI as price formed a wickless black candle today, breaking the support at 47c to close at 46.5c. The lower Bollinger band is at 45.5c while I see a natural support at 45c. For anyone who wants to own some units of LMIR, buying smallish numbers at these prices could be good hedges.  I see 44.5c as a stronger support.


Related post:
Charts in brief: 28 Jun 10.

Charts in brief: 29 April 10.

Thursday, April 29, 2010


CapitaMalls Asia: On 26 April, I said that "when the MACD starts closing the distance with the signal line, that is when we are closing in on a genuine reversal".  The MACD has flattened today while the signal line continues to fall.  A white hammer is formed today.  This is the third reversal signal in a row. It is also the first day that price action has detached from the lower Bollinger band. Even if a reversal does not happen, this suggests that the downward momentum is weakening.  The stochastics continues to rise within the oversold region while the MFI pushes deeper into the oversold region. Mixed signals are more positive than negative in a downtrend. Immediate resistance are at $2.23 and $2.27.


Golden Agriculture: A bearish candlestick setup today as the black candle travelled half the distance down the previous day's white candle. All momentum oscillators are down.  OBV is also down. Saving grace? Reduced volume. Immediate resistance is now provided by the 20dMA at 60.5c while immediate support is still at 57.5c. Weakness is very much obvious and the counter might move to test supports before moving higher.


Courage Marine: A strong Baltic Dry Index (BDI) might be the reason for a levitation act here plus the fact that the counter is trading CD. The BDI is up almost 4% today at 3,329.  This is a boon to Courage Marine, for sure. Counter closed at 22c today, the support provided by the 20dMA.


Even though I really like the fundamentals and I like this company, the technicals are a tad weak and I would not chase it. Momentum oscillators are down.  The MACD continues to pull downwards away from the signal line. The OBV has turned down for two sessions in a row.

However, for someone who is looking for exposure to the counter, the current price should have limited downside with a cluster of supports at 20.5c to 21.5c. Any entry at this level should be considered a hedge. I won't break the piggy bank.


Genting SP: A dramatic reversal today after spotting five reversal signals in a row: black hammer, black spinning top, doji, white hammer, white hammer.  This is a good example of how a counter might have multiple reversal signals before the reversal is confirmed in the usual way.


Extremely high volume up day as two resistance levels were blown away. Next resistance levels are at 97c and $1.02. Momentum oscillators have all turned up strongly. Chances of a follow through are good. Not vested.


Related post:
Charts in brief: 28 April 10.

Genting SP: Downward drift continues.

Thursday, April 22, 2010


I am getting somewhat bored with saying more or less the same things everyday for a while now.  The market has not been very exciting either way.  So, I am giving myself a break from doing a "Charts in brief" post today.  However, Genting SP's price caught my eyes as it touched a low of 85c before closing at 86c today.  I am not vested in this counter but the amount of interest it has generated as the biggest story in Singapore's entertainment and hospitality industries in recent times got me looking on as well.

Technically, it would seem as if a test of the previous low at 83.5c achieved on 4 March is on the cards. The 20d, 50d and 100d MAs are all downtrending.  The MACD is still below zero and has formed a bearish crossover with the signal line.  OBV shows distribution taking place.  MFI shows a lack of buying momentum.  Stochastics has just dipped into oversold territory. 


A bearish picture is obvious, no doubt. However, the selling down lacks strong conviction, in my opinion.  If we look at 18 Feb which was the day the $1.02 support gave way completely, the volume was extremely high.  Volume has been relatively low since that day as price retreated.  I am not saying that price could not go lower but I am saying that the current selling pressure does not seem as great as it was earlier this year.  Having said this, price could go lower and I see 80c as a significant support level.


What if 80c gives way? Well, a look at the weekly chart shows the 100wMA at 75c and this should provide a stronger support.

Related post:
Genting SP: Stale bulls' second chance?

Charts in brief: 8 April 10.

Thursday, April 8, 2010

CapitaMalls Asia: A doji, another reversal signal, was formed today with price closing at $2.29 with the lowest volume in weeks.  A reversal signal again?  Dare I hope?

Golden Agriculture:  Yesterday, I said that with "both the MFI and OBV turning down, which suggest reduced buying momentum and the presence of some distribution, the black spinning top possibly signals a reversal".  The counter went to touch a low of 59c today before closing at 60c.  MFI and OBV continue to decline and we see a sell signal on the MACD. If we look at the chart, the 20dMA has not been very reliable as a support in past instances.  I would look to the 50dMA instead this time for a strong support.  It is currently at 55c.

Saizen REIT: A black candle day as price closed at 17c on lower volume.  Likely short term profit taking.  It is quite clear from the chart that 17c was a resistance level since 22 Jan 10.  We need confirmation in the next few sessions to see if 17c is resistance turned support.  If it is, chances are that price action would be forming a new base at 17c before moving higher.  Such is the slow motion rise of Saizen REIT but the longer term MAs are rising and there is no question that the longer term uptrend is intact.

Healthway Medical: Another gravestone doji as price closed unchanged at 16.5c.  This is somewhat impressive but with the 20dMA and 50dMA both completing their downturns, a move downwards to critical support at 16c looks most likely in the near term.  The MFI has also formed a lower high and this suggests that buying momentum is definitely weakening.

SPH: Reversal signal was negated as SPH formed a nice and long wickless white candle, closing at $3.94.  OBV is rising strongly as accumulation carries on.  MFI has flattened and is not overbought.  A push towards $4.00 is now looking very likely.

AusGroup: Touched a high of 64c on respectable volume but closed at 62c.  This candlestick is very bearish.  63c remains the immediate resistance.  On top of this, the MACD has a sell signal.  However, the MFI has formed a higher low.  This suggests that buying momentum is still strong.  OBV suggests that there is no distribution yet.  AusGroup might try to push higher again but things are looking dicey.

Oceanus: Sell signal confirmed today on the MACD.  Price closed at 36.5c which is support provided by the 100dMA.  We will need confirmation whether this is the new support level.  If it breaks, next support is at 35c.

Genting SP: Volume shrank as price closed at 89.5c.  It would be interesting to see if it continues basing at this level or moves to test the recent low of 83.5c in time.  With MFI and Stochastics near oversold regions, I do not expect any drastic downward movement in price if news stay benign.

China Hongxing: No follow through from yesterday as price formed a black candle, resisted by the declining 50dMA.  Immediate support remains at 15c.  Fundamentally, the company has many challenges and made some bad decisions last year.  The slightest positive newsflow in such a situation might have a strong positive impact on the share price.

Some readers asked if I am vested in all the counters I cover.  I'm not.  I am not vested in the last four counters here, for example.  I do the TA for these for various other reasons.  If you happen to be vested in these counters, I hope the TA is useful to you.

Related post:
Charts in brief: 7 April 2010.

Charts in brief: 7 April 2010.

Wednesday, April 7, 2010

CapitaMalls Asia: Closed unchanged at $2.28 after touching a high of $2.31, forming an inverted black hammer, which, by the way, is another possible reversal signal.  We have been getting many of these reversal signals and none has followed through thus far. MFI has turned down but OBV is flat.  Overall, the suggestion is that the price has found support and is currently going through a basing process.

Golden Agriculture: First black candle in many days and a spinning top at that.  With both the MFI and OBV turning down, which suggest reduced buying momentum and the presence of some distribution, the black spinning top possibly signals a reversal.  Channel resistance is at 64c but will the price move to test this before the week is up? It could happen but, technically, it is obvious that weakness is setting in.

Saizen REIT: Volume has expanded for four days in a row with price closing at 17.5c, forming a wickless white candle, today.  The MFI has surpassed the previous high and is nowhere near overbought.  The buying momentum could strengthen.  OBV has risen sharply, suggesting heightened accumulation.  The MACD continues pulling away from the signal line on the upside, which is bullish.  The declining 50dMA has now turned up, joining the 20d, 100d and 200d MAs in cutting out ascending paths.  The Bollinger bands are just beginning to widen. A move to test the previous high at 18c seems close at hand.

Healthway Medical: Despite a rising MFI, suggesting some positive buying momentum, price action formed a gravestone doji today. Even more ominous, we see the 20dMA beginning to turn down.  MACD is moving closer towards zero.  Unless some heavy volume buy ups happen in the next two or three weeks, the 20dMA seems destined to form a dead cross with the 50dMA and the MACD would be in negative territory.  Support remains at 16c and if this breaks, we should see stronger support at 15c.

SPH: Slight reduction in volume today as the MFI turned down.  OBV is still rising as accumulation continues unabated.  However, the white spinning top formed today suggests indecision.  If this is confirmed as a reversal signal, the journey towards $4.00 would be aborted and $3.82 is the immediate support.

AusGroup:  It seems that 63c remains insurmountable for now.  Price formed a doji, closing at 62c, today.  Although MFI has formed a new high, volume has reduced slightly over a three day period.  There is still a chance of 63c being taken out but volume has to expand on renewed buying ineterest for this to happen.  If volume dwindles, a downward move towards support at 60c is more likely.

Oceanus:  Touched a high of 38c but closing at 37c, price formed a gravestone doji today.  We have a sell signal on the MACD.  Immediate support at 36.5c.  This is where we find the flat 100dMA.  Stronger support is to be found at 35c, where we see a confluence of the 20d, 50d and 200d MAs. Recap: Oceanus.

Genting SP: Touched a high of 92.5c but was resisted by the 20dMA and closed at 90c. Genting SP has emerged from its downtrend in mid March and is now moving sideways. The stochastics and MFI are both near oversold territories.  Price seems to have found support for now and further weakness is expected to be mild if news remain benign. Recap: Genting SP: Obvious downtrend.

China Hongxing: This counter broke out today unexpectedly on high volume, touching a high of 16.5c, it closed at 16c, resisted by the declining 50dMA.  If it manages to close above 16c in the next session, the upside targets are at 18c (100dMA) and 19c (200dMA).  Immediate support is provided by the upturning 20dMA at 15c.  Breaking 16c convincingly would most probably see punters coming in to push it higher towards 18c. Recap: China Hongxing: Downside target?

AIMS AMP Capital Industrial REIT:  Price opened and closed at 22c today, forming a dragonfly doji.  This is the first time it has happened since end January 2010.  We also see a buy signal on the MACD.  OBV is up.  MFI is up.  The Bollinger bands look to be on the verge of widening and if that follows through, this counter is probably going to test the top of the base formation at 23c although, from a chart pattern perspective (where I look out for symmetry), it seems a tad early.  Indeed, the low volume seen today adds an element of caution. Recap: Charts in brief: 19 Mar 10.

LMIR: This counter has to close above a bunching of MAs which are supports turned resistance.  If price could close firmly above 49c in the next few sessions, this objective woud have been achieved.  MFI is rising towards 50%.  Stochastics is rising from the oversold region.  The rising 200dMA is at 47c and should provide support in the event of further weakness. Fundamentals remain strong and I would accumulate on weakness.  Recap: LMIR: More units at 10% yield.

Related post:
Charts in brief: 6 April 2010.

Genting SP: Obvious downtrend.

Sunday, March 21, 2010


Genting SP is in an obvious downtrend.  On 5 March, I said: "If the 50wMA (93.5c) is taken out in the next session, we might see the price rising to the 20dMA, which is descending sharply and should be at 97c then. All eyes would be on whether the price action would be able to break through the 20dMA to close higher, failing which, a resumption of the downtrend is more likely. I still see strong supports provided by the 100wMA (74c) and the 200wMA (70c) then."


Genting SP's price rose past the 20dMA and reached a high of 97.5c on 17 March, forming a white spinning top in the process.  The higher high formed on the MFI shows that buying momentum has strengthened recently.  However the OBV's rise does not mirror the steep fall weeks ago which suggests that the recent accumulation is weak.

On 15 Mar, I said:"This counter has been enjoying a revival lately but on decreasing volume. Daily volume has been lower with the price moving higher since 5 March, the day when price and volume spiked up. This suggests that the buyers are, probably, mostly shortists covering their positions. This is not to say that the price cannot move higher but without a significant number of new participants coming in on the long side, any move upwards would lack sustainability."  The negative divergence in price action and volume is still quite obvious and my earlier observations are still valid.

In the event that price does move up higher, immediate resistance is provided by the 200dMA at 99.5c.  Declining 50dMA is at $1.05.  Lady Luck could be quite generous on occasions.


Related post:
Genting SP: Stale bulls' second chance.
Charts in brief:15 Mar 10.

Charts in brief: 15 Mar 10

Monday, March 15, 2010

I decided to just do a summary, charts not included, to highlight what I think might be some interesting observations for a few counters I charted this evening.  I call this "Charts in brief" and this will be something I might do more often as and when I don't really have a lot to say about any counter in particular.


Golden Agriculture: The sell signal on the MACD is confirmed today.  Price closed at 57c, forming a doji, on reduced volume.  I am still waiting to accumulate at support.  Please see: Golden Agriculture: Waiting for support.

AIMS AMP Capital Industrial REIT:  MFI and OBV both turned up.  The MACD has crossed zero, suggesting a return of positive momentum.  An expansion in trading volume with the next upmove in price would be nice.  Please see: STI and Aims Amp Capital Industrial REIT.

Healthway Medical:  A black candle day but on much reduced volume.  OBV is flat.  So, no distribution.  MFI declined but is still in the overbought region.  Although the uptrend is intact, buying on weakness would be a safer option than buying now and hoping for a breakout.  Basically, the risk premium is much higher now.  Please see: Healthway Medical: A retest of recent high.


Saizen REIT: MACD seems set to make a bearish crossover with the signal line.  MFI has gone into oversold territory; buying momentum is weak. OBV has dipped.  This is a sign of distribution.  The uptrend is intact even if the price should retreat to 15.5c. I know many people ready to pounce on the counter if this should happen.  I would buy more on weakness.  Please see: Saizen REIT: March 2010 presentation.


Genting SP:  This counter has been enjoying a revival lately but on decreasing volume.  Daily volume has been lower with the price moving higher since 5 March, the day when price and volume spiked up.  This suggests that the buyers are, probably, mostly shortists covering their positions.  This is not to say that the price cannot move higher but without a significant number of new participants coming in on the long side, any move upwards would lack sustainability.  Please see: Genting SP: Stale bulls' second chance?

Genting SP: Stale bulls' second chance?

Friday, March 5, 2010

Genting SP experienced a white candle today on increased volume.  As the price touched 91.5c, approaching the 50wMA (93.5c), it lost momentum and closed at 90.5c.  Volume, although higher, is not significantly so.  The suggestion is, therefore, that the buy ups are half hearted.

The MFI and Stochastics are still in oversold regions and seem to suggest that if a reversal does happen, it is not unexpected.  We might want to remember that in a bearish scenario, MFI and Stochastics can stay oversold for a very long time.  MFI and Stochastics are also more accurate indicators in a trendless situation.


So, the price won't go higher?  If the 50wMA (93.5c) is taken out in the next session, we might see the price rising to the 20dMA, which is descending sharply and should be at 97c then.  All eyes would be on whether the price action would be able to break through the 20dMA to close higher, failing which, a resumption of the downtrend is more likely. I still see strong supports provided by the 100wMA (74c) and the 200wMA (70c) then. 

Do people really believe that the opening of Universal Studios on 18 March would have a huge positive impact on Genting SP in the near term?  The jury is still out.  More likely, this upmove is the stale bulls' second chance to reduce exposure or to get out totally as the downtrend is still intact.  Short sellers should find shorting closer to resistance almost irresistable given the bearish technical indicators.

Genting SP: When is it safer to buy?

Thursday, March 4, 2010

On 25 Feb, I wrote the following about Genting SP:

"Genting SP continues to weaken as expected. The highest it got to this week was 98c to give stale bulls a chance to reduce exposure. Closing at 91c today hugs the lower limits of the Bollinger bands. The downtrend seems ready to continue as the MFI continues to decline indicating reducing buying momentum. In the unlikely even that the price moves up in the next session, resistance is at 98c.

"Looking at the weekly chart, we see a precarious situation. Price is hugging the lower limits of the Bollinger bands and the MFI continues to decline just like in the daily chart. However, what is important is that it has closed below the rising 50wMA which is at 92.5c. If price is unable to recapture this support level to close at or above 92.5c in the next session, which is the last trading day of the week, the chart would look very ugly. The ultimate downside target would be 74c, a support level provided by the rising 100wMA. Although there would be intial support at 80c, such a potentially huge fall in price would be too tempting for short sellers to ignore."


Today, Genting SP continued its downward slide, closing at 84.5c.  Momentum oscillators such as the MFI and Stochastics show that the counter is oversold.  The MACD plunges deeper into negative territory.  Longer term MAs are descending with the exception of the 200dMA which now acts as resistance in the event of any rebound.  This is at 98.5c. 


The MFI on the weekly chart is not oversold yet while the MACD is on the verge of plunging below zero.  On a weekly basis, there is a strong suggestion of more downside as well.  Trying to make some money from this counter by punting on the long side is going to require a lot of courage and luck at this juncture.  Having said this, the downside would probably be reaching an inflection point in the near future. 

The proximity of the rising 100wMA and the 200wMA to each other would provide a very strong support at 74c and 70c, respectively.    For investors who really like this counter for some reason, they could consider accumulating then, especially if the MFI and Stochastics indicate heavily oversold conditions by then.

Genting SP: An oasis or a mirage?

Monday, March 1, 2010


Genting SP experienced a white candle day on lower volume.  The MACD is still declining and being below zero, the positive momentum is well and truly over.  MFI has dipped into oversold territory although the stochastics look like it might rise somewhat in the oversold region.  With the momentum oscillators in oversold territory, the counter might attempt a rebound but any rebound should meet with resistance at 98.5c, which is where we find the 200dMA in the daily chart. 


Over the week, we should find resistance at 93.5c, this is where we find the 50wMA on the weekly chart. 

So, on a daily basis, there is a probability that it might hit 98.5c but over the week, 93.5c would probably assert itself as a stronger resistance.  Therefore, expectation is that any upmove to 98.5c, if it happens, would be short lived and would see much selling both by stale bulls and short sellers. 

An upmove this week is most probably not a chance to load up as the downtrend is clear unless the upmove is accompanied by higher volumes which might indicate a budding reversal which remains unlikely.

Golden Agriculture, AusGroup and Genting SP.

Thursday, February 25, 2010


Golden Agriculture failed to move higher today and closed at 54c.  It formed a bearish black candle and with stochastics closer to the overbought region, it doesn't look promising.  On the brighter side, although it has closed lower, it is still above the rising 50dMA.  The 20dMA is turning up.  MFI has formed a higher low and the next session will see if it could continue to do so.  I continue to see resistance at 59c and strong support at 50c. 


AusGroup too formed a black candle as it closed at 58c, supported by the 20dMA.  This is on the back of significantly lower volume.  With the MFI forming a higher high, there might be some momentum left in the upmove.  For stale bulls who missed out on reducing their exposure here in the last couple of sessions, there might still be a chance to do so yet.  Strong resistance is at 63c.


Genting SP continues to weaken as expected.  The highest it got to this week was 98c to give stale bulls a chance to reduce exposure.  Closing at 91c today hugs the lower limits of the Bollinger bands.  The downtrend seems ready to continue as the MFI continues to decline indicating reducing buying momentum.  In the unlikely even that the price moves up in the next session, resistance is at 98c.


Looking at the weekly chart, we see a precarious situation.  Price is hugging the lower limits of the Bollinger bands and the MFI continues to decline just like in the daily chart.  However, what is important is that it has closed below the rising 50wMA which is at 92.5c.  If price is unable to recapture this support level to close at or above 92.5c in the next session, which is the last trading day of the week, the chart would look very ugly.  The ultimate downside target would be 74c, a support level provided by the rising 100wMA.  Although there would be intial support at 80c, such a potentially huge fall in price would be too tempting for short sellers to ignore.


Monthly Popular Blog Posts

All time ASSI most popular!


Bloggy Award